39 Maple St Ramsey, NJ 07446
Estimated Value: $765,036 - $843,000
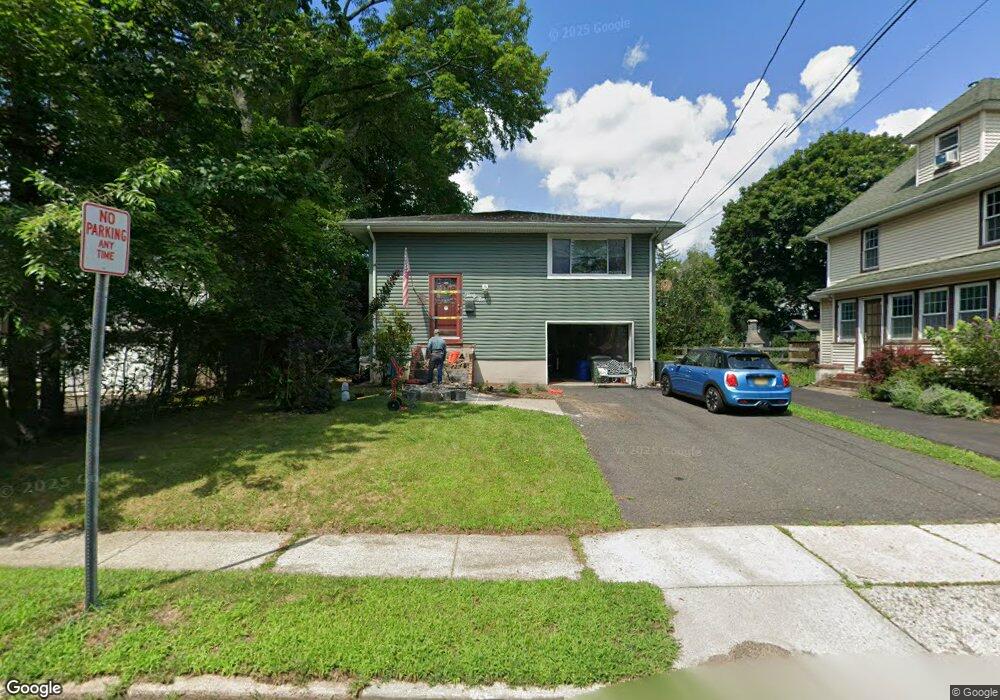
About This Home
This home is located at 39 Maple St, Ramsey, NJ 07446 and is currently estimated at $807,009, approximately $420 per square foot. 39 Maple St is a home located in Bergen County with nearby schools including Ramsey High School and Young World Day School.
Ownership History
We collect this data history from publicly available records. To have your information removed, we recommend requesting removal directly through your county’s website.
Purchase Details
Home Financials for this Owner
Home Financials are based on the most recent Mortgage that was taken out on this home.Home Values in the Area
Average Home Value in this Area
Purchase History
We collect this data history from publicly available records. To have your information removed, we recommend requesting removal directly through your county’s website.
| Date | Buyer | Sale Price | Title Company |
|---|---|---|---|
| $235,000 | Quest Title Agency Inc |
Mortgage History
We collect this data history from publicly available records. To have your information removed, we recommend requesting removal directly through your county’s website.
| Date | Status | Borrower | Loan Amount |
|---|---|---|---|
| Open | $165,000 |
Tax History
We collect this data history from publicly available records. To have your information removed, we recommend requesting removal directly through your county’s website.
| Year | Tax Paid | Tax Assessment Tax Assessment Total Assessment is a certain percentage of the fair market value that is determined by local assessors to be the total taxable value of land and additions on the property. | Land | Improvement |
|---|---|---|---|---|
| 2025 | $13,574 | $616,800 | $308,000 | $308,800 |
| 2024 | $12,949 | $481,000 | $257,900 | $223,100 |
| 2023 | $12,409 | $473,100 | $257,900 | $215,200 |
| 2022 | $12,409 | $473,100 | $257,900 | $215,200 |
| 2021 | $12,267 | $473,100 | $257,900 | $215,200 |
| 2020 | $12,159 | $473,100 | $257,900 | $215,200 |
| 2019 | $11,629 | $473,100 | $257,900 | $215,200 |
| 2018 | $11,340 | $473,100 | $257,900 | $215,200 |
| 2017 | $11,127 | $473,100 | $257,900 | $215,200 |
| 2016 | $10,820 | $473,100 | $257,900 | $215,200 |
| 2015 | $9,467 | $350,500 | $208,400 | $142,100 |
| 2014 | $9,306 | $350,500 | $208,400 | $142,100 |
Map
- 23 Maple St
- 84 S Central Ave
- 92 W Main St
- 96 W Main St
- 44 N Central Ave
- 132 Maple St
- 24 Fox Hollow Rd
- 55 Canterbury Dr
- 314 Canterbury Dr
- 5306 Christopher St
- 129 Woodland Ave
- 66 S Franklin Turnpike Unit 72
- 164 Island Ave
- 14 Chelsea Ct Unit 12
- 61 Sun Valley Rd
- 41 Ramsey Ave
- 32 Addison Place
- 107 Buckingham Dr
- 157 Grove St
- 51 Bedford Place
Ask me questions while you tour the home.