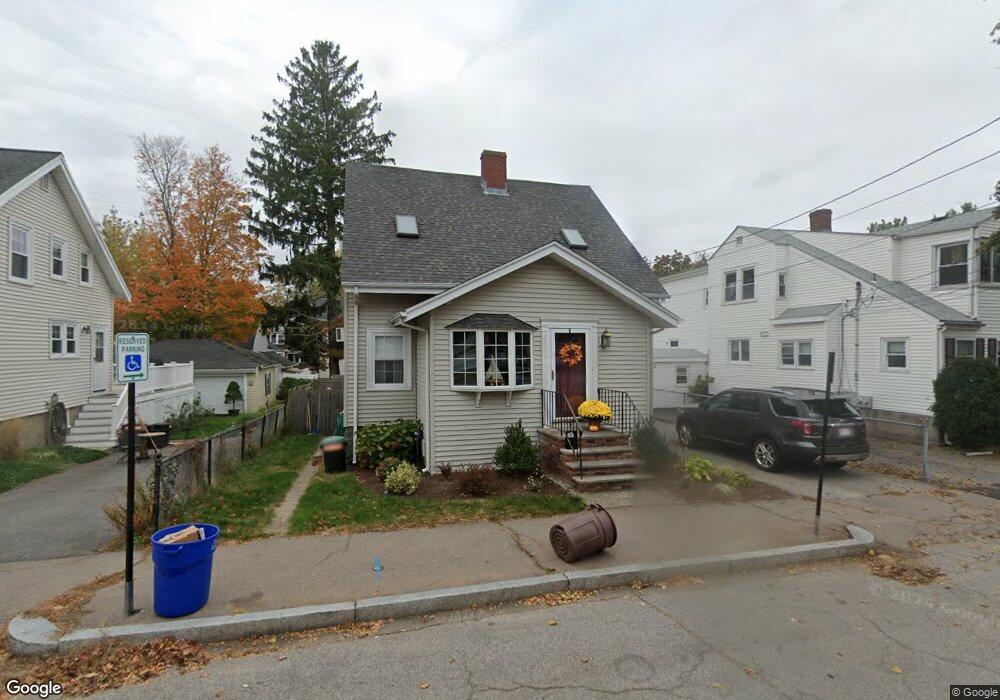
39 Marshall St Quincy, MA 02171
North Quincy NeighborhoodEstimated Value: $715,000 - $784,000
3
Beds
2
Baths
1,451
Sq Ft
$523/Sq Ft
Est. Value
About This Home
This home is located at 39 Marshall St, Quincy, MA 02171 and is currently estimated at $758,863, approximately $522 per square foot. 39 Marshall St is a home located in Norfolk County with nearby schools including Francis W. Parker Elementary School, Atlantic Middle School, and North Quincy High School.
Ownership History
Date
Name
Owned For
Owner Type
Purchase Details
Closed on
Feb 10, 2016
Sold by
Deboer Todd C
Bought by
Deboer Rt and Deboer Todd C
Current Estimated Value
Purchase Details
Closed on
Jul 3, 1979
Bought by
Deboer Robert S
Create a Home Valuation Report for This Property
The Home Valuation Report is an in-depth analysis detailing your home's value as well as a comparison with similar homes in the area
Home Values in the Area
Average Home Value in this Area
Purchase History
We collect this data history from publicly available records. To have your information removed, we recommend requesting removal directly through your county’s website.
| Date | Buyer | Sale Price | Title Company |
|---|---|---|---|
| Deboer Rt | -- | -- | |
| Deboer Robert S | -- | -- | |
| Deboer Robert S | $48,000 | -- |
Source: Public Records
Mortgage History
We collect this data history from publicly available records. To have your information removed, we recommend requesting removal directly through your county’s website.
| Date | Status | Borrower | Loan Amount |
|---|---|---|---|
| Previous Owner | Deboer Robert S | $50,000 |
Source: Public Records
Tax History
| Year | Tax Paid | Tax Assessment Tax Assessment Total Assessment is a certain percentage of the fair market value that is determined by local assessors to be the total taxable value of land and additions on the property. | Land | Improvement |
|---|---|---|---|---|
| 2025 | $7,780 | $674,800 | $355,900 | $318,900 |
| 2024 | $7,545 | $669,500 | $355,900 | $313,600 |
| 2023 | $6,906 | $620,500 | $323,600 | $296,900 |
| 2022 | $6,672 | $556,900 | $258,800 | $298,100 |
| 2021 | $6,146 | $506,300 | $258,800 | $247,500 |
| 2020 | $6,009 | $483,400 | $253,800 | $229,600 |
| 2019 | $5,897 | $469,900 | $244,000 | $225,900 |
| 2018 | $5,818 | $436,100 | $232,400 | $203,700 |
| 2017 | $5,669 | $400,100 | $211,300 | $188,800 |
| 2016 | $5,121 | $356,600 | $192,100 | $164,500 |
| 2015 | $4,751 | $325,400 | $174,600 | $150,800 |
| 2014 | $4,577 | $308,000 | $174,600 | $133,400 |
Source: Public Records
Map
Nearby Homes
- 46 Warwick St
- 153 Vassall St
- 677 Quincy Shore Dr Unit 408
- 75 Walker St
- 16 W Squantum St
- 100 W Squantum St Unit 516
- 113 Elm Ave
- 45 Holbrook Rd
- 175 Quincy Shore Dr Unit B33
- 175 Quincy Shore Dr Unit B66
- 175 Quincy Shore Dr Unit B23
- 185 Quincy Shore Dr Unit U44
- 115 W Squantum St Unit 203
- 851 Quincy Shore Dr
- 150 Hancock St Unit 101
- 35 Sewall St
- 228 Quincy Shore Dr
- 79 Holbrook Rd Unit 2
- 135 Safford St
- 9 Chick St
- 35 Marshall St
- 35 Marshall St Unit 1
- 45 Marshall St
- 33 Marshall St Unit 1
- 33 Marshall St Unit 33
- 33 Marshall St
- 56 French St
- 56 French St Unit 56
- 47 Marshall St
- 60 French St
- 2 Warwick St
- 62 French St
- 53 Marshall St
- 68 French St Unit 68
- 66 French St
- 68 French St Unit 2
- 66 French St Unit 1
- 66 French St Unit 2
- 68 French St
- 8 Warwick St
Your Personal Tour Guide
Ask me questions while you tour the home.