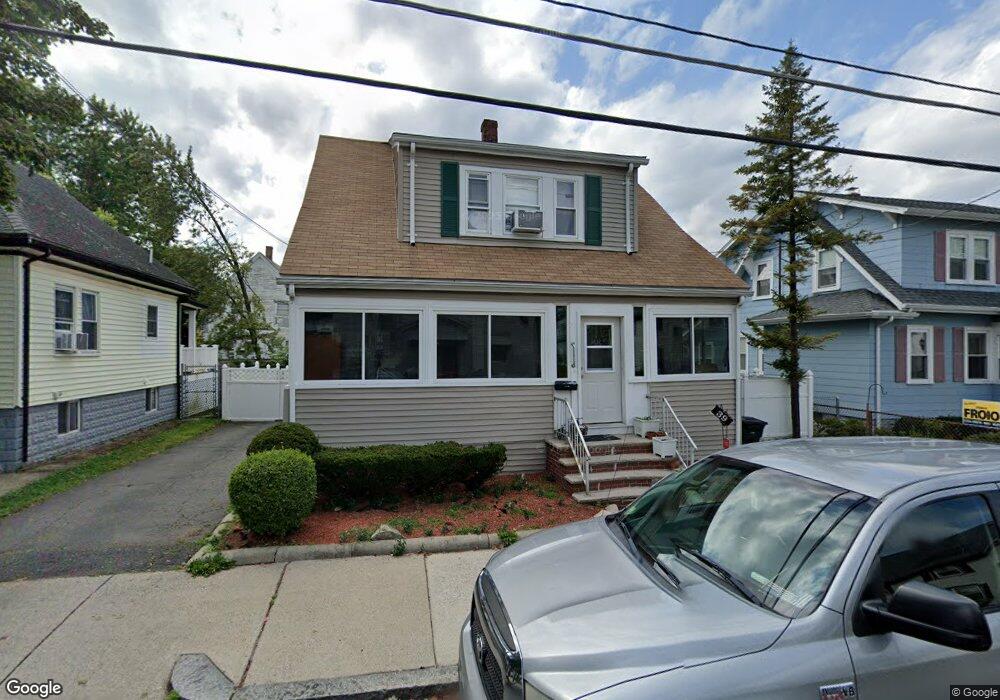
39 Maynard St Malden, MA 02148
Linden NeighborhoodEstimated Value: $611,000 - $654,000
3
Beds
1
Bath
1,329
Sq Ft
$477/Sq Ft
Est. Value
About This Home
This home is located at 39 Maynard St, Malden, MA 02148 and is currently estimated at $633,453, approximately $476 per square foot. 39 Maynard St is a home located in Middlesex County with nearby schools including Malden High School and Malden Catholic.
Ownership History
Date
Name
Owned For
Owner Type
Purchase Details
Closed on
Jul 31, 1997
Sold by
Souza Stanley R and Souza Catherine M
Bought by
Valdoni Victor and Valdoni Rose M
Current Estimated Value
Home Financials for this Owner
Home Financials are based on the most recent Mortgage that was taken out on this home.
Original Mortgage
$129,200
Outstanding Balance
$19,383
Interest Rate
7.55%
Mortgage Type
Purchase Money Mortgage
Estimated Equity
$614,070
Create a Home Valuation Report for This Property
The Home Valuation Report is an in-depth analysis detailing your home's value as well as a comparison with similar homes in the area
Home Values in the Area
Average Home Value in this Area
Purchase History
| Date | Buyer | Sale Price | Title Company |
|---|---|---|---|
| Valdoni Victor | $136,000 | -- | |
| Valdoni Victor | $136,000 | -- |
Source: Public Records
Mortgage History
| Date | Status | Borrower | Loan Amount |
|---|---|---|---|
| Open | Valdoni Victor | $129,200 | |
| Previous Owner | Valdoni Victor | $60,000 |
Source: Public Records
Tax History
| Year | Tax Paid | Tax Assessment Tax Assessment Total Assessment is a certain percentage of the fair market value that is determined by local assessors to be the total taxable value of land and additions on the property. | Land | Improvement |
|---|---|---|---|---|
| 2025 | $62 | $550,100 | $265,600 | $284,500 |
| 2024 | $5,851 | $500,500 | $250,000 | $250,500 |
| 2023 | $5,760 | $472,500 | $226,600 | $245,900 |
| 2022 | $5,504 | $445,700 | $207,000 | $238,700 |
| 2021 | $5,244 | $426,700 | $195,300 | $231,400 |
| 2020 | $5,006 | $395,700 | $180,500 | $215,200 |
| 2019 | $4,767 | $359,200 | $171,900 | $187,300 |
| 2018 | $4,533 | $321,700 | $142,600 | $179,100 |
| 2017 | $4,186 | $295,400 | $142,600 | $152,800 |
| 2016 | $4,060 | $267,800 | $130,900 | $136,900 |
| 2015 | $3,958 | $251,600 | $124,600 | $127,000 |
| 2014 | $3,790 | $235,400 | $113,300 | $122,100 |
Source: Public Records
Map
Nearby Homes
- 1135 Salem St
- 89 Cleveland St
- 65 Central Ave
- 45-47 Durso Ave
- 65-67 Home St
- 75 Goldie St
- 48 Summit St
- 770 Washington Ave Unit 406
- 101 Waite St Unit B5
- 9 Tea Party Way
- 55 Bowman St
- 14 Vining St
- 37-39 Reserve St
- 44-46 Myrtle St
- 65 Jacob St
- 33 Lodgen Ct Unit 2D
- 44 Loomis St Unit 309
- 17 Tyler St
- 113 Grover St
- 41 Webber St Unit 1
- 43 Maynard St
- 35 Maynard St
- 40 Claremont St
- 38 Claremont St
- 38 Claremont St Unit 1
- 47 Maynard St
- 31 Maynard St
- 40 Maynard St
- 44 Claremont St
- 44 Maynard St
- 36 Maynard St
- 46 Maynard St Unit 48
- 46-48 Maynard St
- 34 Claremont St
- 51 Maynard St
- 27 Maynard St
- 32 Maynard St
- 52 Claremont St
- 52 Maynard St
- 54 Claremont St
Your Personal Tour Guide
Ask me questions while you tour the home.