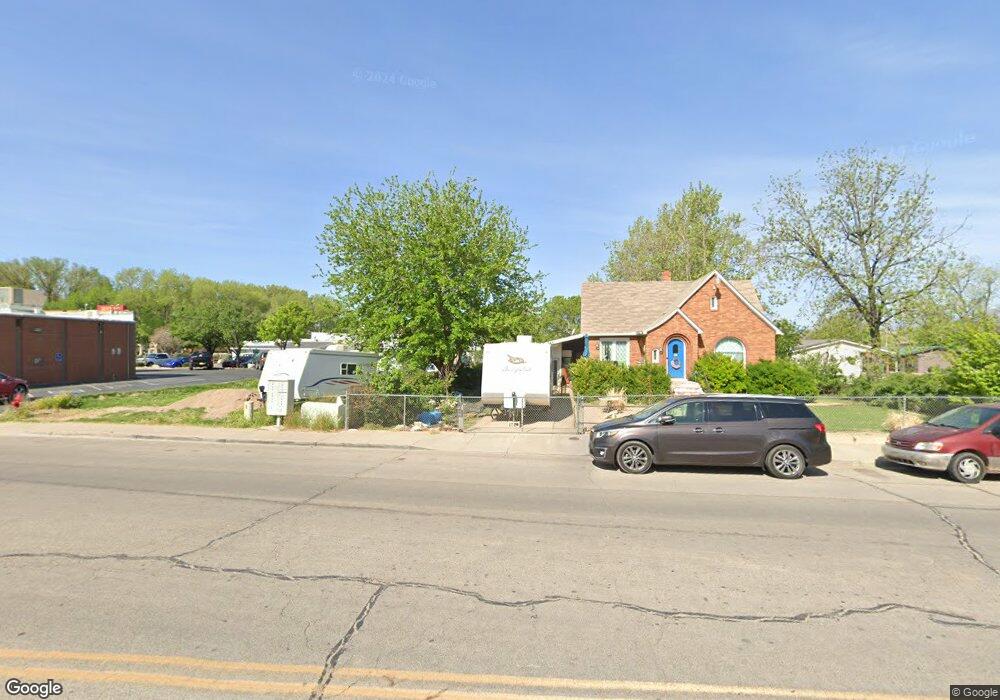
39 N Main St Hurricane, UT 84737
Estimated Value: $449,508 - $587,000
5
Beds
3
Baths
2,644
Sq Ft
$190/Sq Ft
Est. Value
About This Home
This home is located at 39 N Main St, Hurricane, UT 84737 and is currently estimated at $501,877, approximately $189 per square foot. 39 N Main St is a home located in Washington County with nearby schools including Hurricane High School, Hurricane Middle School, and Hurricane Elementary School.
Ownership History
Date
Name
Owned For
Owner Type
Purchase Details
Closed on
Dec 14, 2021
Sold by
Heninger Trevor and Heninger Kaylee
Bought by
Heninger Trevor Ellys and Heninger Kaylee
Current Estimated Value
Home Financials for this Owner
Home Financials are based on the most recent Mortgage that was taken out on this home.
Original Mortgage
$216,000
Outstanding Balance
$196,965
Interest Rate
3.09%
Mortgage Type
New Conventional
Estimated Equity
$304,912
Purchase Details
Closed on
Feb 28, 2005
Sold by
Odum Herman F and Odum Kathleen
Bought by
Hansen Merlin A and Hansen Nadine R
Home Financials for this Owner
Home Financials are based on the most recent Mortgage that was taken out on this home.
Original Mortgage
$113,200
Interest Rate
5.65%
Mortgage Type
New Conventional
Create a Home Valuation Report for This Property
The Home Valuation Report is an in-depth analysis detailing your home's value as well as a comparison with similar homes in the area
Purchase History
We collect this data history from publicly available records. To have your information removed, we recommend requesting removal directly through your county’s website.
| Date | Buyer | Sale Price | Title Company |
|---|---|---|---|
| Heninger Trevor Ellys | -- | Lydolph & Weierholt Ttl Ins | |
| Hansen Merlin A | -- | Terra Title Co |
Source: Public Records
Mortgage History
We collect this data history from publicly available records. To have your information removed, we recommend requesting removal directly through your county’s website.
| Date | Status | Borrower | Loan Amount |
|---|---|---|---|
| Open | Heninger Trevor Ellys | $216,000 | |
| Closed | Hansen Merlin A | $113,200 |
Source: Public Records
Tax History
| Year | Tax Paid | Tax Assessment Tax Assessment Total Assessment is a certain percentage of the fair market value that is determined by local assessors to be the total taxable value of land and additions on the property. | Land | Improvement |
|---|---|---|---|---|
| 2025 | $1,749 | $245,630 | $104,500 | $141,130 |
| 2023 | $1,693 | $227,150 | $89,375 | $137,775 |
| 2022 | $2,056 | $258,610 | $56,595 | $202,015 |
| 2021 | $1,796 | $333,800 | $74,900 | $258,900 |
| 2020 | $1,414 | $245,600 | $72,700 | $172,900 |
| 2019 | $1,253 | $211,200 | $64,300 | $146,900 |
| 2018 | $1,360 | $113,355 | $0 | $0 |
| 2017 | $1,132 | $94,380 | $0 | $0 |
| 2016 | $1,169 | $94,380 | $0 | $0 |
| 2015 | $1,165 | $90,640 | $0 | $0 |
| 2014 | $962 | $77,880 | $0 | $0 |
Source: Public Records
Map
Nearby Homes
- 77 S 100 E
- 161 N 160 E
- 175 N 160 E
- 272 N 200 E
- 199 N 200 E
- 256 N 200 E Unit 51
- 391 N 200 E
- 342 N 200 E
- 459 N 200 E
- 256 N 200 E
- 342 N 200 E Unit 21
- 459 N 200 E Unit 5
- 286 N 200 E Unit 48
- 289 N 200 E Unit 45
- 391 N 200 E Unit 38
- 199 N 200 E Unit 54
- 375 N 200 E Unit 39
- 286 N 200 E
- 289 N 200 E
- 339 N 200 E Unit 41
Your Personal Tour Guide
Ask me questions while you tour the home.