39 Parkin St Springfield, MA 01104
Liberty Heights NeighborhoodEstimated Value: $215,000 - $239,737
About This Home
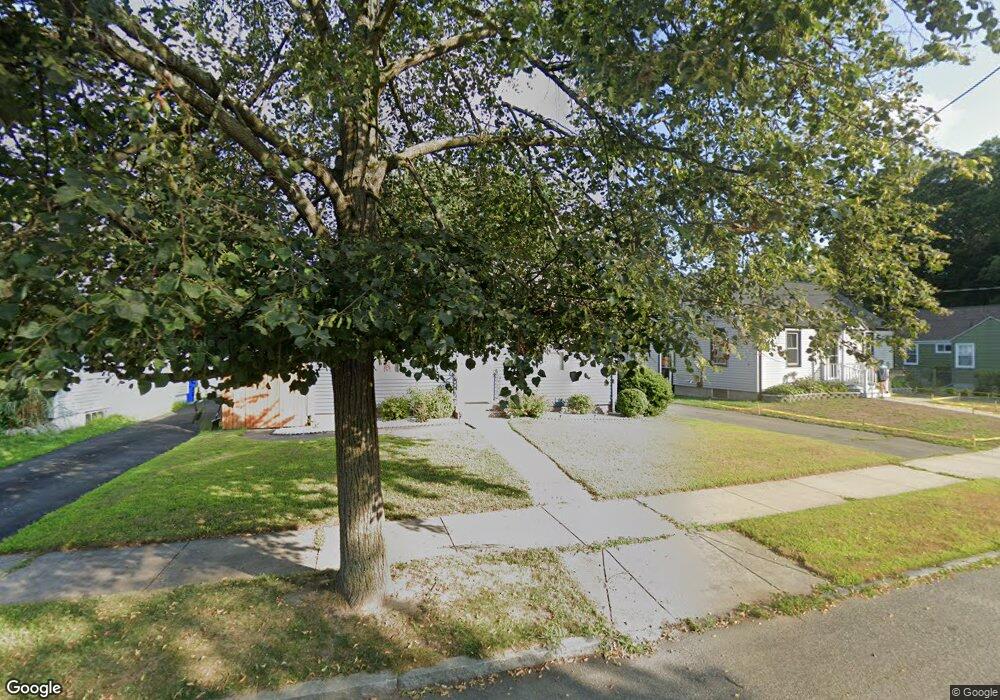
This home is located at 39 Parkin St, Springfield, MA 01104 and is currently estimated at $229,684, approximately $308 per square foot. 39 Parkin St is a home located in Hampden County with nearby schools including Glenwood School, Van Sickle Academy, and High School Of Commerce.
Ownership History
We collect this data history from publicly available records. To have your information removed, we recommend requesting removal directly through your county’s website.
Purchase Details
Home Financials for this Owner
Home Financials are based on the most recent Mortgage that was taken out on this home.Purchase Details
Home Values in the Area
Average Home Value in this Area
Purchase History
We collect this data history from publicly available records. To have your information removed, we recommend requesting removal directly through your county’s website.
| Date | Buyer | Sale Price | Title Company |
|---|---|---|---|
| $74,000 | -- | ||
| $26,000 | -- |
Mortgage History
We collect this data history from publicly available records. To have your information removed, we recommend requesting removal directly through your county’s website.
| Date | Status | Borrower | Loan Amount |
|---|---|---|---|
| Open | $50,300 | ||
| Previous Owner | $25,000 | ||
| Previous Owner | $15,000 | ||
| Closed | $20,000 |
Tax History
We collect this data history from publicly available records. To have your information removed, we recommend requesting removal directly through your county’s website.
| Year | Tax Paid | Tax Assessment Tax Assessment Total Assessment is a certain percentage of the fair market value that is determined by local assessors to be the total taxable value of land and additions on the property. | Land | Improvement |
|---|---|---|---|---|
| 2025 | $3,037 | $193,700 | $38,600 | $155,100 |
| 2024 | $2,626 | $163,500 | $38,600 | $124,900 |
| 2023 | $2,537 | $148,800 | $34,100 | $114,700 |
| 2022 | $2,533 | $134,600 | $31,900 | $102,700 |
| 2021 | $2,279 | $120,600 | $29,000 | $91,600 |
| 2020 | $2,260 | $115,700 | $29,000 | $86,700 |
| 2019 | $2,047 | $104,000 | $31,500 | $72,500 |
| 2018 | $2,043 | $103,800 | $31,500 | $72,300 |
| 2017 | $1,980 | $100,700 | $28,500 | $72,200 |
| 2016 | $1,921 | $97,700 | $27,000 | $70,700 |
| 2015 | $1,823 | $92,700 | $27,000 | $65,700 |
Map
- 267 Connecticut Ave
- 130 Connecticut Ave
- 115 Connecticut Ave
- 20 Athol St
- 907-909 Liberty St
- 128-130 Woodmont St
- 85 Farnsworth St
- 18 Los Angeles St
- 127 Governor St
- 78 Governor St
- 827-831 Armory St
- 400 Nottingham St
- 585 Armory St
- 774-776 Liberty St
- 646-648 Carew St
- 540 Armory St
- 38 Phoenix St
- 138 Wilber St
- 127 Melha Ave
- 179 Knollwood St
Ask me questions while you tour the home.