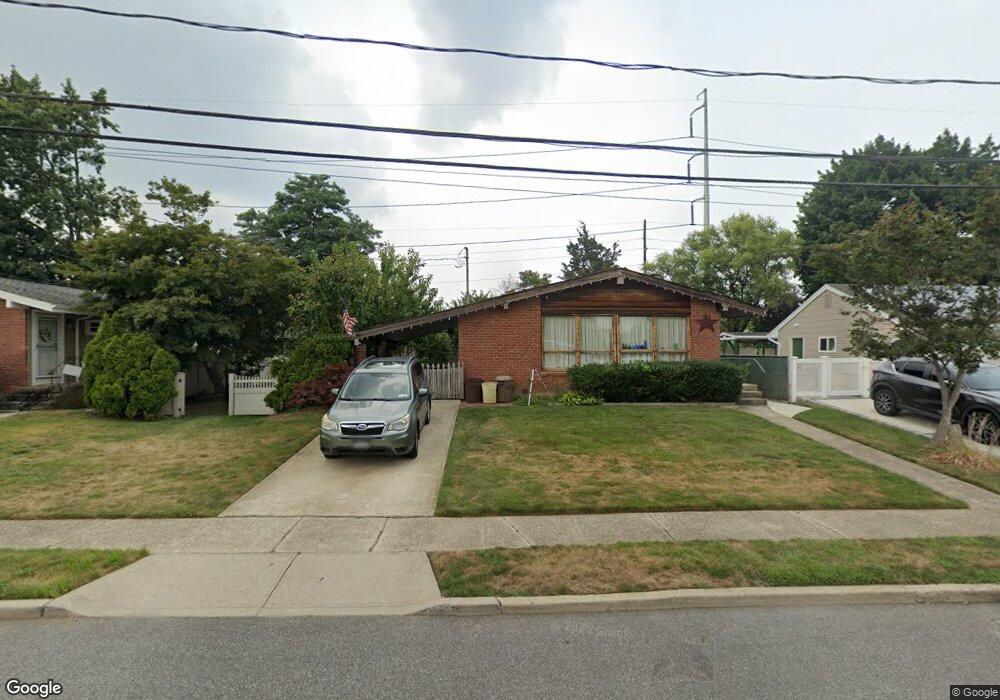
39 Pickwick Dr Hicksville, NY 11801
Estimated Value: $724,000 - $743,060
Studio
1
Bath
1,056
Sq Ft
$695/Sq Ft
Est. Value
About This Home
This home is located at 39 Pickwick Dr, Hicksville, NY 11801 and is currently estimated at $733,530, approximately $694 per square foot. 39 Pickwick Dr is a home located in Nassau County with nearby schools including Hicksville Middle School, Hicksville High School, and Our Lady Of Mercy School.
Ownership History
Date
Name
Owned For
Owner Type
Purchase Details
Closed on
Oct 3, 2013
Sold by
Kennedy Sinead M and Basile Sinead Kennedy
Bought by
Basile Brian
Current Estimated Value
Home Financials for this Owner
Home Financials are based on the most recent Mortgage that was taken out on this home.
Original Mortgage
$10,224
Outstanding Balance
$6,738
Interest Rate
4.58%
Estimated Equity
$726,792
Purchase Details
Closed on
Oct 15, 2007
Sold by
Orourke Garren
Bought by
Kennedy Sinead
Create a Home Valuation Report for This Property
The Home Valuation Report is an in-depth analysis detailing your home's value as well as a comparison with similar homes in the area
Home Values in the Area
Average Home Value in this Area
Purchase History
| Date | Buyer | Sale Price | Title Company |
|---|---|---|---|
| Basile Brian | $10,000 | Commonwealth Land Title Insu | |
| Kennedy Sinead | $415,000 | -- |
Source: Public Records
Mortgage History
| Date | Status | Borrower | Loan Amount |
|---|---|---|---|
| Open | Basile Brian | $10,224 |
Source: Public Records
Tax History
| Year | Tax Paid | Tax Assessment Tax Assessment Total Assessment is a certain percentage of the fair market value that is determined by local assessors to be the total taxable value of land and additions on the property. | Land | Improvement |
|---|---|---|---|---|
| 2025 | $8,649 | $410 | $244 | $166 |
| 2024 | $3,663 | $414 | $246 | $168 |
Source: Public Records
Map
Nearby Homes
Your Personal Tour Guide
Ask me questions while you tour the home.