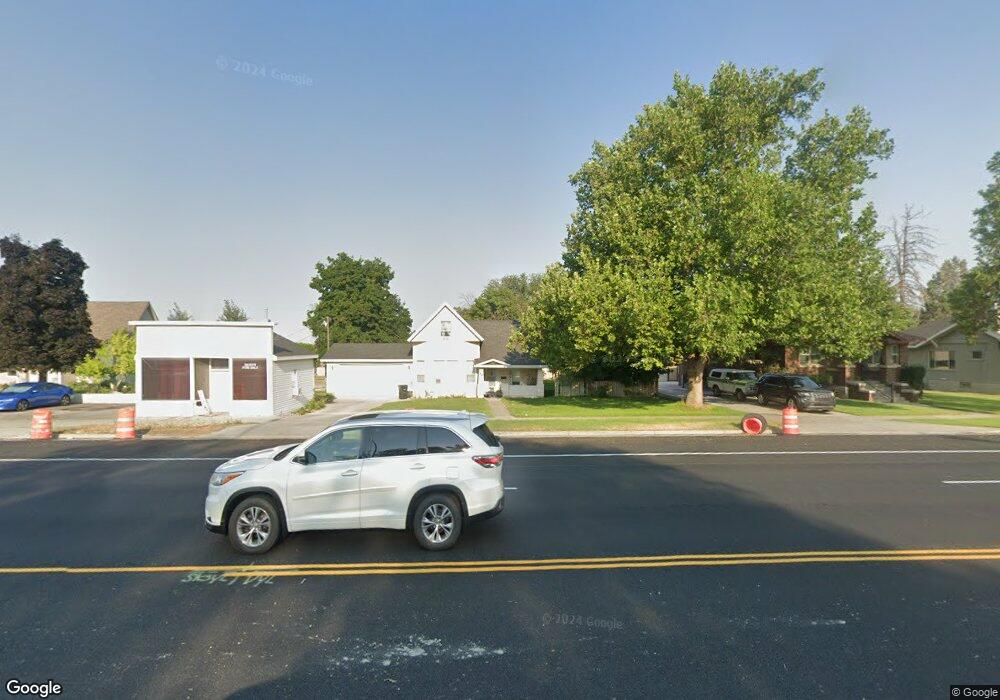
39 S Main St Smithfield, UT 84335
Estimated Value: $353,000 - $393,000
3
Beds
1
Bath
1,714
Sq Ft
$215/Sq Ft
Est. Value
About This Home
This home is located at 39 S Main St, Smithfield, UT 84335 and is currently estimated at $368,616, approximately $215 per square foot. 39 S Main St is a home located in Cache County with nearby schools including Summit School, North Cache Middle School, and White Pine Middle School.
Ownership History
Date
Name
Owned For
Owner Type
Purchase Details
Closed on
Dec 31, 2019
Sold by
Porter Christopher R
Bought by
Porter Christopher N and Porter Tausha
Current Estimated Value
Home Financials for this Owner
Home Financials are based on the most recent Mortgage that was taken out on this home.
Original Mortgage
$7,238
Outstanding Balance
$6,368
Interest Rate
3.6%
Mortgage Type
Stand Alone Second
Estimated Equity
$362,248
Purchase Details
Closed on
Dec 26, 2019
Sold by
Thomas Phil W and Thomas Carole Ann
Bought by
Porter Christopher R
Home Financials for this Owner
Home Financials are based on the most recent Mortgage that was taken out on this home.
Original Mortgage
$7,238
Outstanding Balance
$6,368
Interest Rate
3.6%
Mortgage Type
Stand Alone Second
Estimated Equity
$362,248
Purchase Details
Closed on
Apr 2, 2019
Sold by
Thomas Phil W and Rlt Carole
Bought by
Storey Tyler K and Storey Elsie A
Purchase Details
Closed on
May 11, 2009
Sold by
Thomas Phil and Thomas Carole Ann
Bought by
Thomas Phil W and Thomas Carole Ann
Purchase Details
Closed on
May 5, 2009
Sold by
Bingham Carol
Bought by
Thomas Phil and Thomas Carole Ann
Create a Home Valuation Report for This Property
The Home Valuation Report is an in-depth analysis detailing your home's value as well as a comparison with similar homes in the area
Home Values in the Area
Average Home Value in this Area
Purchase History
| Date | Buyer | Sale Price | Title Company |
|---|---|---|---|
| Porter Christopher N | -- | Cache Title Logan | |
| Porter Christopher R | -- | American Secure Title Logan | |
| Storey Tyler K | -- | None Available | |
| Thomas Phil W | -- | Hickman Land Title Company | |
| Thomas Phil | -- | Hickman Land Title Company |
Source: Public Records
Mortgage History
| Date | Status | Borrower | Loan Amount |
|---|---|---|---|
| Open | Porter Christopher R | $7,238 | |
| Open | Porter Christopher R | $212,970 |
Source: Public Records
Tax History
| Year | Tax Paid | Tax Assessment Tax Assessment Total Assessment is a certain percentage of the fair market value that is determined by local assessors to be the total taxable value of land and additions on the property. | Land | Improvement |
|---|---|---|---|---|
| 2025 | $1,564 | $209,365 | $0 | $0 |
| 2024 | $1,716 | $215,460 | $0 | $0 |
| 2023 | $1,806 | $214,485 | $0 | $0 |
| 2022 | $166 | $194,520 | $0 | $0 |
| 2021 | $1,644 | $259,512 | $98,750 | $160,762 |
| 2020 | $1,558 | $225,375 | $98,750 | $126,625 |
| 2019 | $1,393 | $194,801 | $70,409 | $124,392 |
| 2018 | $1,361 | $182,609 | $70,409 | $112,200 |
| 2017 | $1,217 | $102,060 | $0 | $0 |
| 2016 | $1,238 | $102,060 | $0 | $0 |
| 2015 | $1,243 | $102,060 | $0 | $0 |
| 2014 | $1,219 | $102,065 | $0 | $0 |
| 2013 | -- | $102,065 | $0 | $0 |
Source: Public Records
Map
Nearby Homes
Your Personal Tour Guide
Ask me questions while you tour the home.