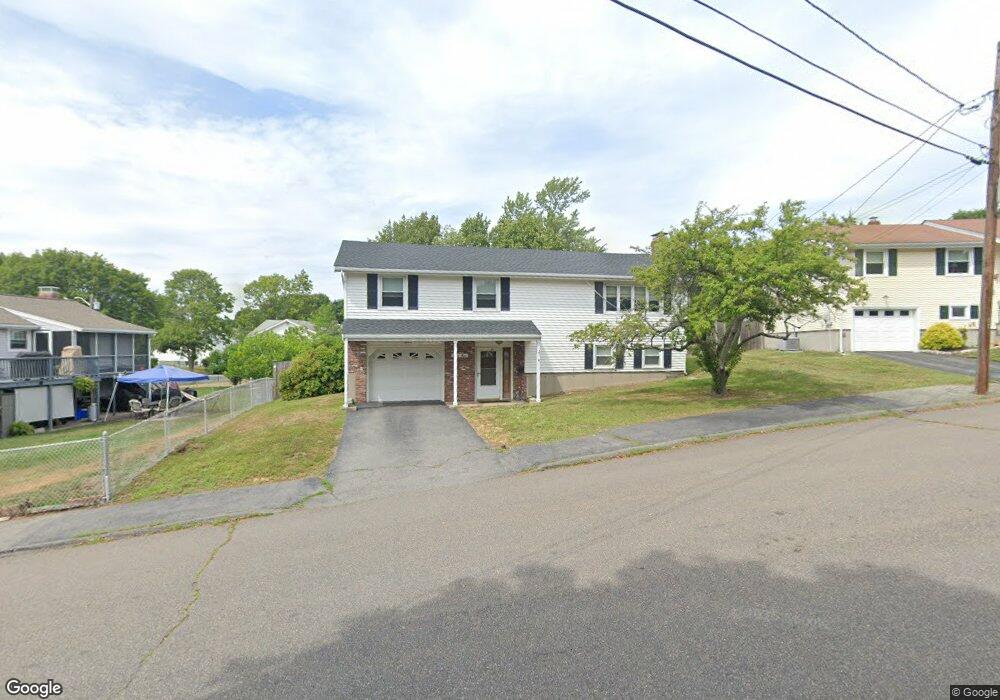
39 Sable Rd Salem, MA 01970
Witchcraft Heights NeighborhoodEstimated Value: $614,491 - $695,000
3
Beds
2
Baths
1,695
Sq Ft
$393/Sq Ft
Est. Value
About This Home
This home is located at 39 Sable Rd, Salem, MA 01970 and is currently estimated at $666,373, approximately $393 per square foot. 39 Sable Rd is a home located in Essex County with nearby schools including Witchcraft Heights Elementary School, Horace Mann Laboratory, and Bates Elementary School.
Ownership History
Date
Name
Owned For
Owner Type
Purchase Details
Closed on
Jun 3, 2011
Sold by
39 Sable Road Nt
Bought by
Conte Sheri
Current Estimated Value
Home Financials for this Owner
Home Financials are based on the most recent Mortgage that was taken out on this home.
Original Mortgage
$200,000
Outstanding Balance
$137,309
Interest Rate
4.85%
Mortgage Type
Purchase Money Mortgage
Estimated Equity
$529,064
Create a Home Valuation Report for This Property
The Home Valuation Report is an in-depth analysis detailing your home's value as well as a comparison with similar homes in the area
Home Values in the Area
Average Home Value in this Area
Purchase History
| Date | Buyer | Sale Price | Title Company |
|---|---|---|---|
| Conte Sheri | $300,000 | -- |
Source: Public Records
Mortgage History
| Date | Status | Borrower | Loan Amount |
|---|---|---|---|
| Open | Conte Sheri | $40,000 | |
| Open | Conte Sheri | $200,000 |
Source: Public Records
Tax History
| Year | Tax Paid | Tax Assessment Tax Assessment Total Assessment is a certain percentage of the fair market value that is determined by local assessors to be the total taxable value of land and additions on the property. | Land | Improvement |
|---|---|---|---|---|
| 2025 | $6,045 | $533,100 | $193,400 | $339,700 |
| 2024 | $5,927 | $510,100 | $193,400 | $316,700 |
| 2023 | $5,735 | $458,400 | $177,000 | $281,400 |
| 2022 | $5,745 | $433,600 | $170,400 | $263,200 |
| 2021 | $5,639 | $408,600 | $170,400 | $238,200 |
| 2020 | $5,823 | $403,000 | $160,600 | $242,400 |
| 2019 | $5,818 | $385,300 | $152,700 | $232,600 |
| 2018 | $5,489 | $356,900 | $145,500 | $211,400 |
| 2017 | $5,277 | $332,700 | $137,700 | $195,000 |
| 2016 | $4,956 | $316,300 | $121,300 | $195,000 |
| 2015 | $4,777 | $291,100 | $111,400 | $179,700 |
Source: Public Records
Map
Nearby Homes
- 7 Gables Cir
- 176 Marlborough Rd
- 4 Valley St
- 2 Osborne St
- 5 Willson Rd
- 20 Beacon St
- 1 Fountain St
- 12 Varney St
- 18 1/2 Dalton Ct Unit 18 1/2
- 23 Proctor St
- 128 Boston St Unit 4
- 68 Beaver St
- 6 Whalers Ln Unit 6
- 98 Foster St
- 111 Foster St Unit 416
- 18 Dalton Pkwy Unit 18
- 11 Strongwater Dr
- 80 Foster St Unit 501
- 80 Foster St Unit 507
- 64 Foster St Unit 403
Your Personal Tour Guide
Ask me questions while you tour the home.