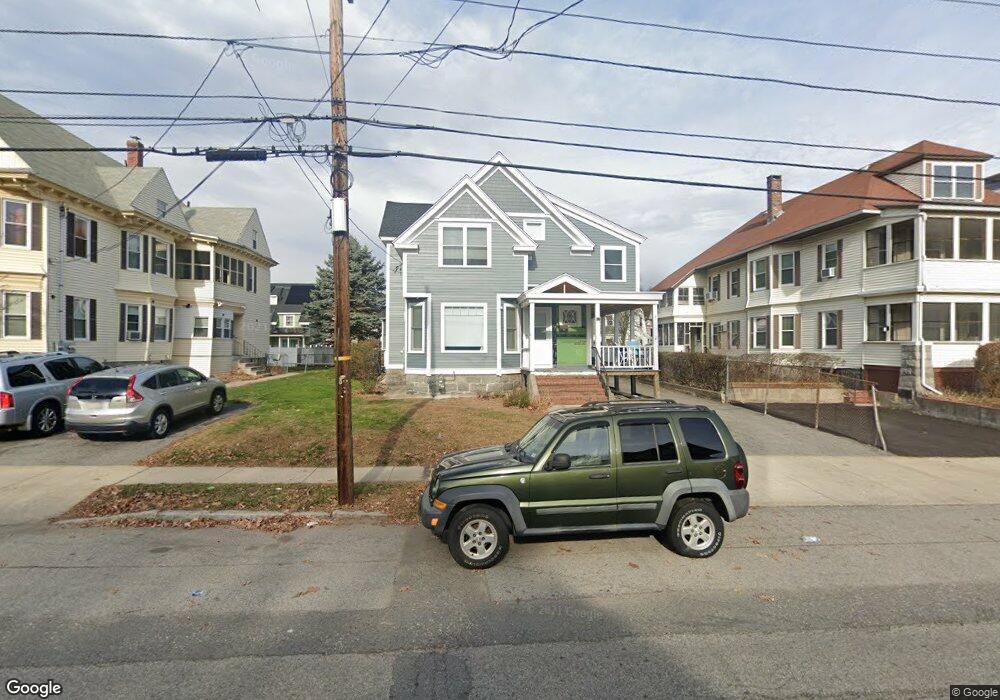
39 Salem St Lawrence, MA 01843
South Common NeighborhoodEstimated Value: $466,000 - $540,000
4
Beds
1
Bath
1,543
Sq Ft
$332/Sq Ft
Est. Value
About This Home
This home is located at 39 Salem St, Lawrence, MA 01843 and is currently estimated at $511,973, approximately $331 per square foot. 39 Salem St is a home located in Essex County with nearby schools including John Breen School, South Lawrence East Elementary School, and School For Exceptional Studies.
Ownership History
Date
Name
Owned For
Owner Type
Purchase Details
Closed on
Jan 9, 2018
Sold by
Delaney Ft
Bought by
Delaney Martin F
Current Estimated Value
Purchase Details
Closed on
Dec 22, 2014
Sold by
Delaney Helena I
Bought by
Delaney Ft and Delaney Martin F
Create a Home Valuation Report for This Property
The Home Valuation Report is an in-depth analysis detailing your home's value as well as a comparison with similar homes in the area
Home Values in the Area
Average Home Value in this Area
Purchase History
| Date | Buyer | Sale Price | Title Company |
|---|---|---|---|
| Delaney Martin F | -- | -- | |
| Delaney Ft | -- | -- |
Source: Public Records
Tax History
| Year | Tax Paid | Tax Assessment Tax Assessment Total Assessment is a certain percentage of the fair market value that is determined by local assessors to be the total taxable value of land and additions on the property. | Land | Improvement |
|---|---|---|---|---|
| 2025 | $3,832 | $435,500 | $106,300 | $329,200 |
| 2024 | $3,897 | $421,300 | $115,100 | $306,200 |
| 2023 | $4,028 | $396,500 | $106,700 | $289,800 |
| 2022 | $3,757 | $328,400 | $96,700 | $231,700 |
| 2021 | $3,172 | $258,500 | $96,700 | $161,800 |
| 2020 | $2,936 | $236,200 | $91,700 | $144,500 |
| 2019 | $2,915 | $213,100 | $76,200 | $136,900 |
| 2018 | $2,685 | $187,500 | $72,200 | $115,300 |
| 2017 | $2,629 | $171,400 | $68,100 | $103,300 |
| 2016 | $2,488 | $160,400 | $56,200 | $104,200 |
| 2015 | $2,425 | $160,400 | $56,200 | $104,200 |
Source: Public Records
Map
Nearby Homes
- 119 Andover St
- 161-167 S Union St
- 151-153 Bailey St
- 100 Union St
- 100 Bailey St Unit 1
- 143 Foster St
- 356-360 S Union St
- 46-46A Dorchester St
- 18 Winthrop Ave
- 27-29 Dorchester St
- 7 Stevens Ct
- 219 Waverley Rd
- 11 Cambridge St
- 31 Garfield St
- 52 Howard St
- 350 Greene St Unit 410
- 350 Greene St Unit 305
- 76 Allston St
- 82 S Broadway
- 27 Woodland Ct
- 37 Salem St Unit 37A
- 43-45 Salem St
- 43 Salem St Unit 45
- 35 Salem St Unit 35A
- 27 Loring St
- 90 Greenfield St
- 29 Loring St
- 86 Greenfield St
- 94 Greenfield St
- 35 Loring St Unit 39
- 35-39 Loring St
- 34A Salem St
- 33 Salem St Unit 33A
- 33-33A Salem St
- 55 Salem St Unit 1L
- 55 Salem St Unit 57
- 34 Salem St
- 53 Salem St
- 96 Greenfield St
- 40 Salem St Unit 42
Your Personal Tour Guide
Ask me questions while you tour the home.