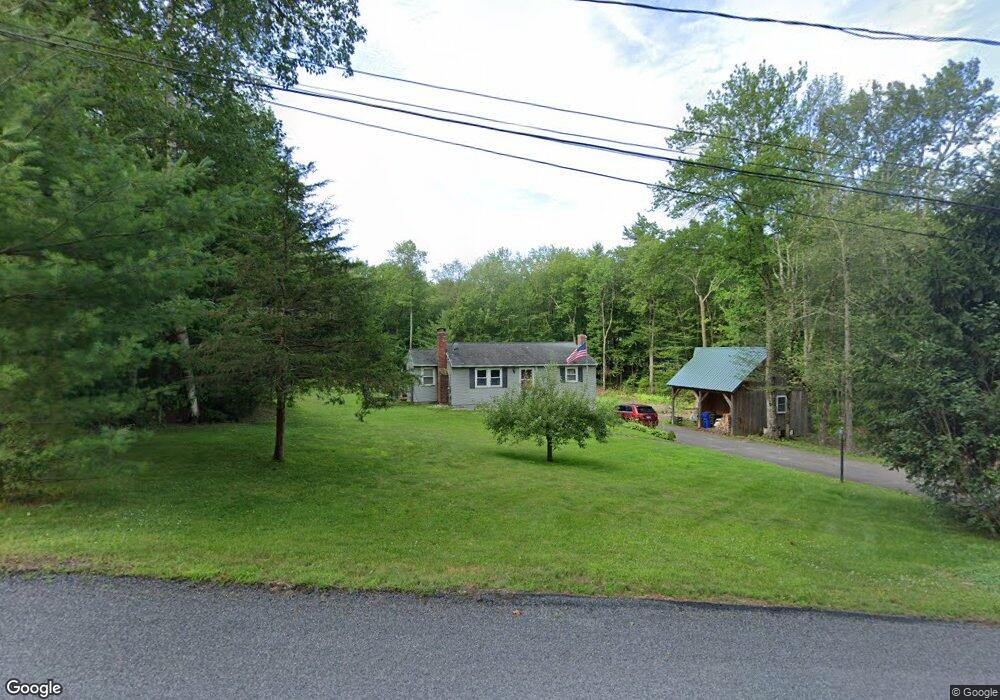
39 South Rd Barkhamsted, CT 06063
Estimated Value: $247,000 - $312,000
2
Beds
1
Bath
904
Sq Ft
$306/Sq Ft
Est. Value
About This Home
This home is located at 39 South Rd, Barkhamsted, CT 06063 and is currently estimated at $276,407, approximately $305 per square foot. 39 South Rd is a home located in Litchfield County with nearby schools including Barkhamsted Elementary School, Northwestern Regional Middle School, and Northwestern Regional High School.
Ownership History
Date
Name
Owned For
Owner Type
Purchase Details
Closed on
Oct 7, 2010
Sold by
Downey Travis R
Bought by
Downey Travis R and Downey Elizabeth B
Current Estimated Value
Purchase Details
Closed on
Dec 5, 2002
Sold by
Moore Robert J
Bought by
Downey Travis R
Home Financials for this Owner
Home Financials are based on the most recent Mortgage that was taken out on this home.
Original Mortgage
$137,750
Interest Rate
6.34%
Create a Home Valuation Report for This Property
The Home Valuation Report is an in-depth analysis detailing your home's value as well as a comparison with similar homes in the area
Home Values in the Area
Average Home Value in this Area
Purchase History
| Date | Buyer | Sale Price | Title Company |
|---|---|---|---|
| Downey Travis R | -- | -- | |
| Downey Travis R | $145,000 | -- |
Source: Public Records
Mortgage History
| Date | Status | Borrower | Loan Amount |
|---|---|---|---|
| Previous Owner | Downey Travis R | $30,000 | |
| Previous Owner | Downey Travis R | $137,750 | |
| Previous Owner | Downey Travis R | $55,000 | |
| Previous Owner | Downey Travis R | $20,000 |
Source: Public Records
Tax History
| Year | Tax Paid | Tax Assessment Tax Assessment Total Assessment is a certain percentage of the fair market value that is determined by local assessors to be the total taxable value of land and additions on the property. | Land | Improvement |
|---|---|---|---|---|
| 2025 | $4,018 | $158,380 | $44,270 | $114,110 |
| 2024 | $4,055 | $158,380 | $44,270 | $114,110 |
| 2023 | $3,963 | $116,770 | $43,810 | $72,960 |
| 2022 | $3,906 | $116,770 | $43,810 | $72,960 |
| 2021 | $3,878 | $116,770 | $43,810 | $72,960 |
| 2020 | $3,787 | $116,770 | $43,810 | $72,960 |
| 2019 | $3,810 | $116,770 | $43,810 | $72,960 |
| 2018 | $3,461 | $109,810 | $41,720 | $68,090 |
| 2017 | $3,339 | $107,710 | $41,720 | $65,990 |
| 2016 | $2,961 | $98,650 | $41,720 | $56,930 |
| 2015 | $2,898 | $98,650 | $41,720 | $56,930 |
| 2014 | $2,861 | $98,650 | $41,720 | $56,930 |
Source: Public Records
Map
Nearby Homes
- 21 Kelsey Ct
- 86 Case St
- 21 Legeyt Rd
- 33 N Canton Rd
- 679 Cherry Brook Rd
- 45 Barkhamsted Rd
- 199 Broad Hill Rd
- 125 Firetown Rd
- 00 Hartland Blvd
- 16 Stonewall Dr
- 170 Simsbury Rd
- 12 The Glade
- 516 Cherry Brook Rd
- 324 Old Farms Rd
- 117 N Saddle Ridge
- 158 Westledge Rd
- 5 Sanctuary Dr
- 11 Timbercrest Dr
- 48 Cider Mill Heights
- 3 Lenora Dr
Your Personal Tour Guide
Ask me questions while you tour the home.