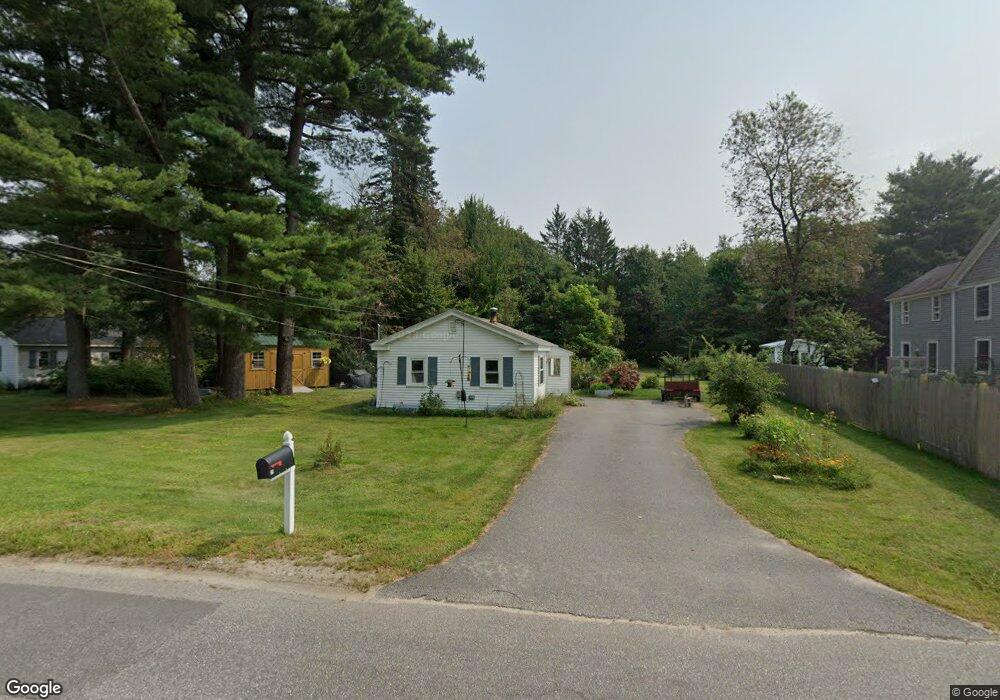
39 Tedford Rd Topsham, ME 04086
Estimated Value: $203,723 - $350,000
1
Bed
1
Bath
440
Sq Ft
$606/Sq Ft
Est. Value
About This Home
This home is located at 39 Tedford Rd, Topsham, ME 04086 and is currently estimated at $266,431, approximately $605 per square foot. 39 Tedford Rd is a home located in Sagadahoc County with nearby schools including Mt Ararat High School, Harpswell Coastal Academy Divisions 2 and 3, and St John's Catholic School.
Ownership History
Date
Name
Owned For
Owner Type
Purchase Details
Closed on
Sep 4, 2018
Sold by
Huey Brian L and Huey Anita S
Bought by
Warnock Sarah T
Current Estimated Value
Home Financials for this Owner
Home Financials are based on the most recent Mortgage that was taken out on this home.
Original Mortgage
$98,989
Outstanding Balance
$85,789
Interest Rate
4.5%
Mortgage Type
New Conventional
Estimated Equity
$180,642
Purchase Details
Closed on
Jun 27, 2016
Sold by
Ryder Blanche E
Bought by
Huey Brian L and Huey Anita S
Create a Home Valuation Report for This Property
The Home Valuation Report is an in-depth analysis detailing your home's value as well as a comparison with similar homes in the area
Home Values in the Area
Average Home Value in this Area
Purchase History
| Date | Buyer | Sale Price | Title Company |
|---|---|---|---|
| Warnock Sarah T | -- | -- | |
| Huey Brian L | -- | -- |
Source: Public Records
Mortgage History
| Date | Status | Borrower | Loan Amount |
|---|---|---|---|
| Open | Warnock Sarah T | $98,989 |
Source: Public Records
Tax History
| Year | Tax Paid | Tax Assessment Tax Assessment Total Assessment is a certain percentage of the fair market value that is determined by local assessors to be the total taxable value of land and additions on the property. | Land | Improvement |
|---|---|---|---|---|
| 2025 | $2,143 | $167,400 | $65,100 | $102,300 |
| 2024 | $1,934 | $154,700 | $60,300 | $94,400 |
| 2023 | $1,871 | $137,800 | $57,600 | $80,200 |
| 2022 | $1,764 | $122,300 | $55,500 | $66,800 |
| 2021 | $1,763 | $111,100 | $51,000 | $60,100 |
| 2020 | $1,786 | $100,000 | $51,000 | $49,000 |
| 2019 | $1,838 | $96,000 | $51,000 | $45,000 |
| 2018 | $1,605 | $85,700 | $45,600 | $40,100 |
| 2017 | $1,553 | $85,700 | $45,600 | $40,100 |
| 2016 | $1,533 | $85,200 | $45,600 | $39,600 |
| 2015 | $1,507 | $83,900 | $45,600 | $38,300 |
| 2014 | $1,447 | $83,500 | $45,600 | $37,900 |
| 2013 | $1,390 | $83,500 | $45,600 | $37,900 |
Source: Public Records
Map
Nearby Homes
Your Personal Tour Guide
Ask me questions while you tour the home.