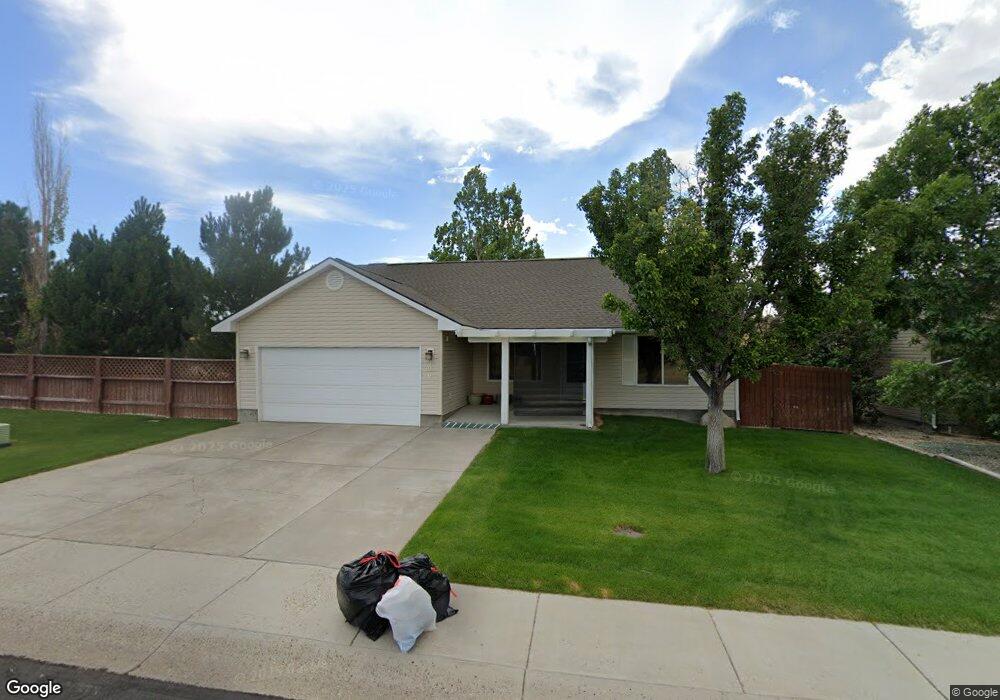
390 Double Down Cir Jackpot, NV 89825
Estimated Value: $336,000 - $369,609
3
Beds
2
Baths
1,370
Sq Ft
$262/Sq Ft
Est. Value
About This Home
This home is located at 390 Double Down Cir, Jackpot, NV 89825 and is currently estimated at $358,652, approximately $261 per square foot. 390 Double Down Cir is a home with nearby schools including Jackpot Elementary School, Jackpot Junior High School, and Jackpot High School.
Ownership History
Date
Name
Owned For
Owner Type
Purchase Details
Closed on
Sep 4, 2025
Sold by
Club 93 Inc
Bought by
Anderson Steven R
Current Estimated Value
Create a Home Valuation Report for This Property
The Home Valuation Report is an in-depth analysis detailing your home's value as well as a comparison with similar homes in the area
Purchase History
| Date | Buyer | Sale Price | Title Company |
|---|---|---|---|
| Anderson Steven R | $375,000 | Stewart Title |
Source: Public Records
Tax History
| Year | Tax Paid | Tax Assessment Tax Assessment Total Assessment is a certain percentage of the fair market value that is determined by local assessors to be the total taxable value of land and additions on the property. | Land | Improvement |
|---|---|---|---|---|
| 2025 | $1,960 | $61,074 | $8,662 | $52,411 |
| 2024 | $1,960 | $61,969 | $8,662 | $53,307 |
| 2023 | $1,749 | $58,704 | $8,662 | $50,042 |
| 2022 | $1,619 | $51,208 | $8,662 | $42,546 |
| 2021 | $1,772 | $49,915 | $8,662 | $41,253 |
| 2020 | $1,678 | $50,451 | $8,662 | $41,789 |
| 2019 | $1,620 | $48,237 | $8,662 | $39,575 |
| 2018 | $1,623 | $48,467 | $8,662 | $39,805 |
| 2017 | $1,481 | $47,820 | $8,662 | $39,158 |
| 2016 | $1,496 | $47,948 | $8,662 | $39,286 |
| 2015 | $1,485 | $47,349 | $8,662 | $38,687 |
| 2014 | $1,467 | $45,510 | $8,662 | $36,848 |
Source: Public Records
Map
Nearby Homes
- 0 Double Down Cir
- 0 Pinochle St
- 387 Lady Luck Dr
- 3056 Monte Carlo Dr
- 1081 N US Hwy Hwy
- 2279 Gurley Dr
- 0 Royal Dr
- 0 U S 93
- 0 Glendoren Dr
- 0 Glen Doren Unit 3627198
- MINERAL Hot Springs Hwy Unit 93
- 1516 N 2290 E
- 0 4th Idaho Unit 3627652
- 1512 N 2272 E
- 1521 N 2284 E
- TBD Kimberly Rd
- 2040 E 2200 N
- 2436B Oakley Ave
- TBD Oakley Ave
- TBD Hollister
- 391 Double Down Cir
- 368 Double Down Cir
- 2735 Monte Carlo Dr
- 356 Double Down Cir
- 2768 Monte Carlo Dr
- 2769 Monte Carlo Dr
- 338 Double Down Cir
- 314 Double Down Cir
- 324 Double Down Cir
- 332 Double Down Cir
- 2793 Monte Carlo Dr
- 327 Lady Luck Dr
- 0 Royal Flush Dr Dr Unit 3626421
- 0 Royal Flush Dr Dr Unit 3616745
- 2805 Monte Carlo Dr
- 2829 Monte Carlo Dr
- 286 Bacarrat Ct
- 2851 Monte Carlo Dr
- 2840 Monte Carlo Dr
- 2878 Monte Carlo Dr
Your Personal Tour Guide
Ask me questions while you tour the home.