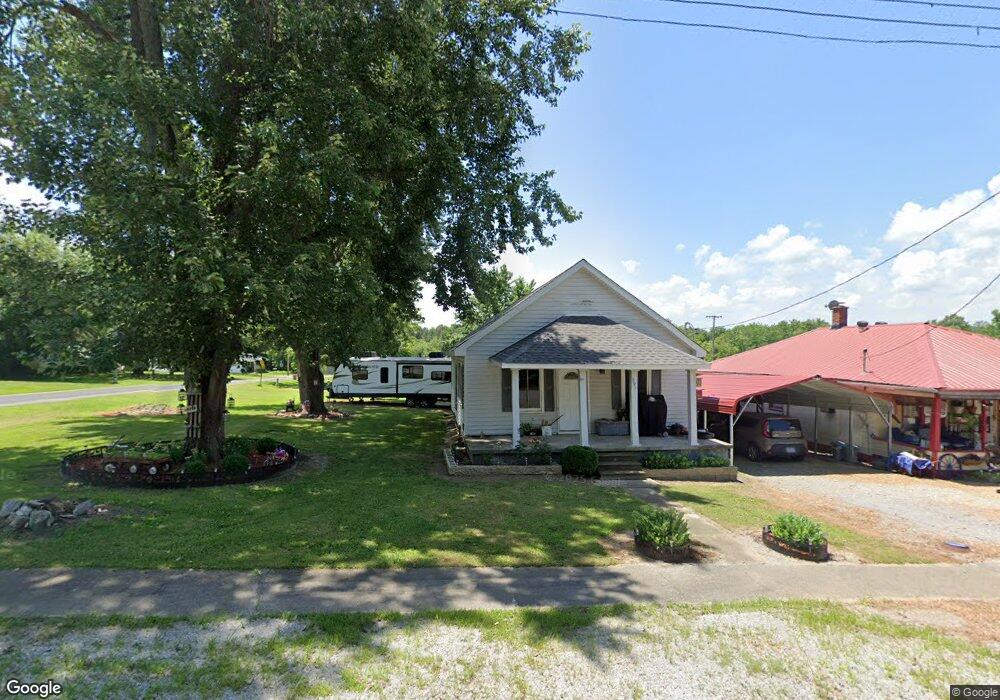
390 E Cedar St Olmsted, IL 62970
Estimated Value: $44,000
2
Beds
--
Bath
864
Sq Ft
$51/Sq Ft
Est. Value
About This Home
This home is located at 390 E Cedar St, Olmsted, IL 62970 and is currently priced at $44,000, approximately $50 per square foot. 390 E Cedar St is a home with nearby schools including Meridian Elementary School, Meridian High School, and Caledonia Christian Academy.
Ownership History
Date
Name
Owned For
Owner Type
Purchase Details
Closed on
Dec 20, 2013
Sold by
Kelley Scottie C and Kelley Connie F
Bought by
Kelley Beverly
Current Estimated Value
Create a Home Valuation Report for This Property
The Home Valuation Report is an in-depth analysis detailing your home's value as well as a comparison with similar homes in the area
Purchase History
| Date | Buyer | Sale Price | Title Company |
|---|---|---|---|
| Kelley Beverly | -- | -- |
Source: Public Records
Mortgage History
| Date | Status | Borrower | Loan Amount |
|---|---|---|---|
| Closed | Kelley Beverly | $0 |
Source: Public Records
Tax History
| Year | Tax Paid | Tax Assessment Tax Assessment Total Assessment is a certain percentage of the fair market value that is determined by local assessors to be the total taxable value of land and additions on the property. | Land | Improvement |
|---|---|---|---|---|
| 2024 | $546 | $6,903 | $227 | $6,676 |
| 2023 | $546 | $6,244 | $205 | $6,039 |
| 2022 | $524 | $6,244 | $205 | $6,039 |
| 2021 | $538 | $6,244 | $205 | $6,039 |
| 2020 | $507 | $6,244 | $205 | $6,039 |
| 2019 | $526 | $6,244 | $205 | $6,039 |
| 2018 | $502 | $6,244 | $205 | $6,039 |
| 2017 | $437 | $4,521 | $701 | $3,820 |
| 2016 | $419 | $3,939 | $611 | $3,328 |
| 2015 | -- | $3,939 | $611 | $3,328 |
| 2014 | $345 | $3,939 | $611 | $3,328 |
| 2013 | $345 | $3,939 | $611 | $3,328 |
| 2012 | $345 | $3,939 | $611 | $3,328 |
Source: Public Records
Map
Nearby Homes
- 550 S Vienna Rd
- 1050 Feather Trail Rd
- 2919 Feather Trail Rd
- 466 Turner Landing Rd
- 000 Center Church Rd
- 601 Ohio St
- 700 Vine St
- 0 Lincoln St
- 228 N Reader St
- 209 N Reader St
- 216 N Delaware St
- 000 S 51 Rd S
- 0 Holloway Landing Rd
- 473 Needmore Rd
- 1408 Illinois 169
- 4844 Bandana Rd
- 261 Ullin Ave
- 000 Holloway Landing Rd
- 696 Monroe Dr
- 526 Broadway St
- 360 E Cedar St
- 350 E Cedar St
- 230 E Cedar St
- 440 E Cedar St
- 320 W Cedar St
- 401 E Cedar St
- 460 E Cedar St
- 301 E Cedar St
- 191 E Cedar St
- 290 E Cedar St
- 370 E Caledonia St
- 480 E Cedar St
- 340 W Caledonia St
- 410 E Caledonia St
- 398 E Caledonia St
- 291 Paradise St
- 270 E Cedar St
- 375 E Caledonia St
- 250 E Cedar St
- 290 Paradise St
Your Personal Tour Guide
Ask me questions while you tour the home.