Estimated Value: $446,000 - $533,000
3
Beds
1
Bath
1,701
Sq Ft
$284/Sq Ft
Est. Value
About This Home
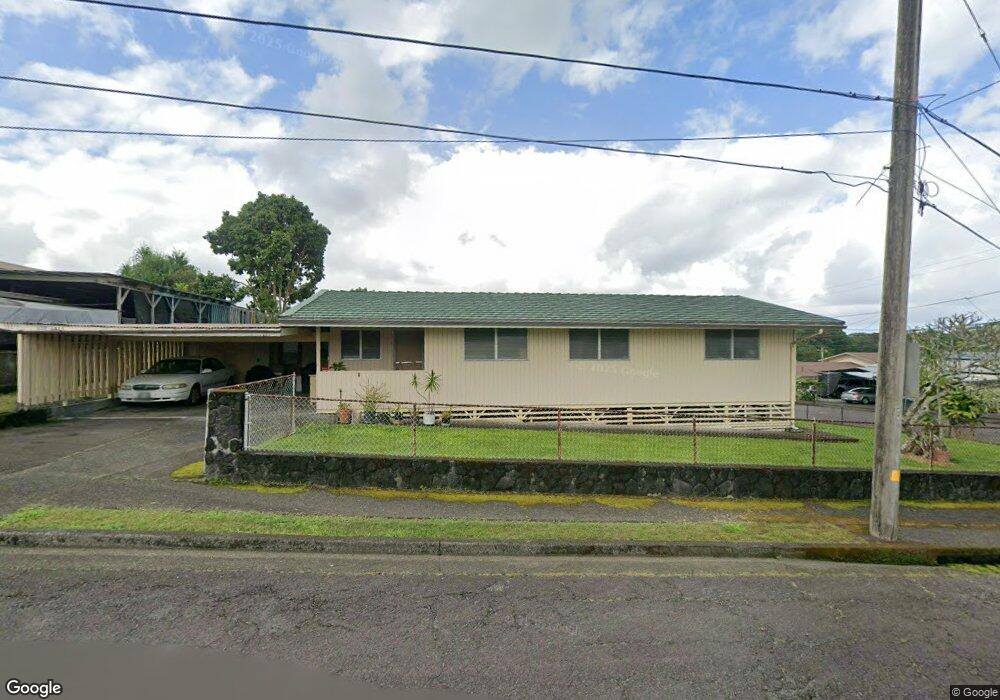
This home is located at 390 Iloko St, Hilo, HI 96720 and is currently estimated at $483,573, approximately $284 per square foot. 390 Iloko St is a home located in Hawaii County with nearby schools including Chiefess Kapiolani Elementary School, Hilo Intermediate School, and Hilo High School.
Ownership History
Date
Name
Owned For
Owner Type
Purchase Details
Closed on
May 4, 1999
Sold by
Kawata Yoko
Bought by
Arakaki Yeiko and Arakaki Caroline
Current Estimated Value
Home Financials for this Owner
Home Financials are based on the most recent Mortgage that was taken out on this home.
Original Mortgage
$72,250
Outstanding Balance
$18,514
Interest Rate
6.94%
Mortgage Type
Purchase Money Mortgage
Estimated Equity
$465,060
Purchase Details
Closed on
Nov 1, 1996
Sold by
Kawata Yoko
Bought by
Kawata Yoko and Yoko Kawata Revocable Living Trust
Create a Home Valuation Report for This Property
The Home Valuation Report is an in-depth analysis detailing your home's value as well as a comparison with similar homes in the area
Home Values in the Area
Average Home Value in this Area
Purchase History
| Date | Buyer | Sale Price | Title Company |
|---|---|---|---|
| Arakaki Yeiko | $85,000 | -- | |
| Kawata Yoko | -- | -- |
Source: Public Records
Mortgage History
| Date | Status | Borrower | Loan Amount |
|---|---|---|---|
| Open | Arakaki Yeiko | $72,250 |
Source: Public Records
Tax History
| Year | Tax Paid | Tax Assessment Tax Assessment Total Assessment is a certain percentage of the fair market value that is determined by local assessors to be the total taxable value of land and additions on the property. | Land | Improvement |
|---|---|---|---|---|
| 2025 | $208 | $156,300 | $33,100 | $123,200 |
| 2024 | $200 | $151,700 | $33,100 | $118,600 |
| 2023 | $202 | $147,300 | $33,100 | $114,200 |
| 2022 | $212 | $143,000 | $33,100 | $109,900 |
| 2021 | $200 | $138,800 | $33,100 | $105,700 |
| 2020 | $200 | $134,800 | $33,100 | $101,700 |
| 2019 | $200 | $261,800 | $66,200 | $195,600 |
| 2018 | $379 | $127,100 | $33,100 | $94,000 |
| 2017 | $361 | $123,400 | $33,100 | $90,300 |
| 2016 | $343 | $119,800 | $33,100 | $86,700 |
| 2015 | $236 | $116,300 | $33,100 | $83,200 |
| 2014 | $236 | $112,900 | $33,100 | $79,800 |
Source: Public Records
Map
Nearby Homes
- 62 Popolo St
- 390 Mohouli St
- 423 Lanikukia Place
- 415 Lanikukia Place
- 932 Kumukoa St Unit C104
- 433 Kukuau St
- 350 Kapiolani St
- 555 Kukuau St Unit A203
- 525 Mohouli St
- 572 Kukuau St
- 511 Kaanini St
- 272 Kapiolani St Unit 304
- 420 Huali Place
- 136 Mauna Loa St
- 698 Kukuau St
- 708 Kukuau St
- 37 Mehau Ln
- 1322 Ululani St
- 301 Ponahawai St
- 82 Hoku St Unit D
Your Personal Tour Guide
Ask me questions while you tour the home.