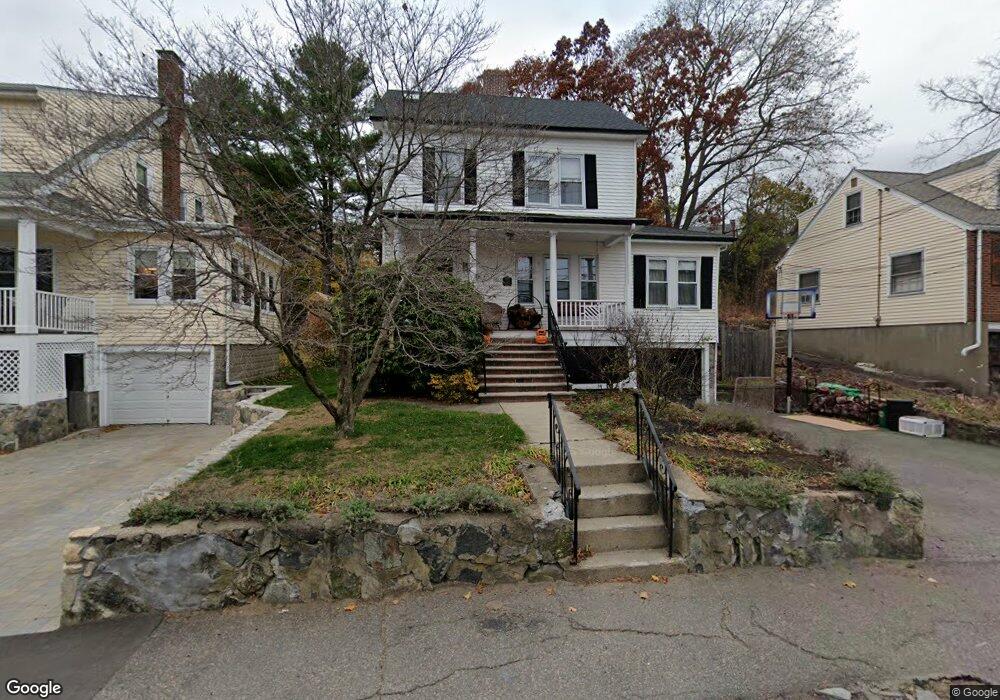
391 Appleton St Arlington, MA 02476
Arlington Heights NeighborhoodEstimated Value: $887,000 - $1,211,000
About This Home
This home is located at 391 Appleton St, Arlington, MA 02476 and is currently estimated at $1,072,326, approximately $450 per square foot. 391 Appleton St is a home located in Middlesex County with nearby schools including Dallin Elementary School, Ottoson Middle School, and Arlington High School.
Ownership History
We collect this data history from publicly available records. To have your information removed, we recommend requesting removal directly through your county’s website.
Purchase Details
Home Values in the Area
Average Home Value in this Area
Purchase History
We collect this data history from publicly available records. To have your information removed, we recommend requesting removal directly through your county’s website.
| Date | Buyer | Sale Price | Title Company |
|---|---|---|---|
| $189,000 | -- |
Mortgage History
We collect this data history from publicly available records. To have your information removed, we recommend requesting removal directly through your county’s website.
| Date | Status | Borrower | Loan Amount |
|---|---|---|---|
| Open | $174,000 | ||
| Closed | $25,000 | ||
| Closed | $44,300 |
Tax History
We collect this data history from publicly available records. To have your information removed, we recommend requesting removal directly through your county’s website.
| Year | Tax Paid | Tax Assessment Tax Assessment Total Assessment is a certain percentage of the fair market value that is determined by local assessors to be the total taxable value of land and additions on the property. | Land | Improvement |
|---|---|---|---|---|
| 2025 | $10,530 | $977,700 | $477,400 | $500,300 |
| 2024 | $9,690 | $915,000 | $459,500 | $455,500 |
| 2023 | $9,698 | $865,100 | $429,700 | $435,400 |
| 2022 | $9,283 | $812,900 | $417,700 | $395,200 |
| 2021 | $9,091 | $801,700 | $417,700 | $384,000 |
| 2020 | $8,869 | $801,900 | $417,700 | $384,200 |
| 2019 | $7,889 | $700,600 | $411,800 | $288,800 |
| 2018 | $7,340 | $605,100 | $316,300 | $288,800 |
| 2017 | $7,375 | $587,200 | $298,400 | $288,800 |
| 2016 | $6,893 | $538,500 | $274,500 | $264,000 |
| 2015 | $6,859 | $506,200 | $256,600 | $249,600 |
Map
- 44 Piedmont St
- 34 Nicod St
- 299 Appleton St
- 4 Aerial St
- 22 Williams St
- 233 Florence Ave
- 211 Florence Ave
- 6 West St
- 283 Florence Ave
- 147 Charlton St
- 93 Hathaway Cir
- 42 Peacock Farm Rd
- 74 Rhinecliff St
- 3 Chase Ave
- 40 Tanager St
- 38 Tanager St Unit 1
- 53 Wollaston Ave Unit 1
- 70 Birch Hill Rd
- 53 Birch Hill Rd
- 65 Oak St
Ask me questions while you tour the home.