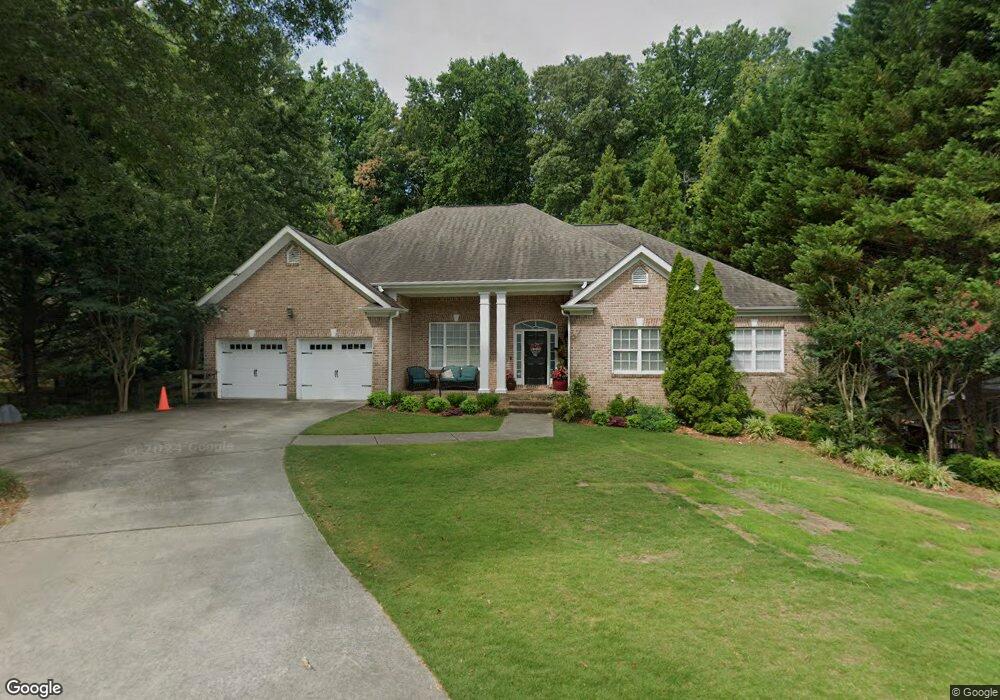
391 Hunter St Norcross, GA 30071
Estimated Value: $510,000 - $578,000
3
Beds
3
Baths
2,396
Sq Ft
$225/Sq Ft
Est. Value
About This Home
This home is located at 391 Hunter St, Norcross, GA 30071 and is currently estimated at $538,312, approximately $224 per square foot. 391 Hunter St is a home located in Gwinnett County with nearby schools including Susan Stripling Elementary School, Pinckneyville Middle School, and Paul Duke STEM High School.
Ownership History
Date
Name
Owned For
Owner Type
Purchase Details
Closed on
Oct 20, 2008
Sold by
Lancaster Leland
Bought by
Lancaster Leland R and Lancaster Leland B
Current Estimated Value
Purchase Details
Closed on
Dec 30, 2005
Sold by
Lancaster Betty H
Bought by
Lancaster Leland
Create a Home Valuation Report for This Property
The Home Valuation Report is an in-depth analysis detailing your home's value as well as a comparison with similar homes in the area
Home Values in the Area
Average Home Value in this Area
Purchase History
| Date | Buyer | Sale Price | Title Company |
|---|---|---|---|
| Lancaster Leland R | -- | -- | |
| Lancaster Leland | -- | -- |
Source: Public Records
Tax History
| Year | Tax Paid | Tax Assessment Tax Assessment Total Assessment is a certain percentage of the fair market value that is determined by local assessors to be the total taxable value of land and additions on the property. | Land | Improvement |
|---|---|---|---|---|
| 2025 | $5,052 | $204,200 | $37,600 | $166,600 |
| 2024 | $5,207 | $204,200 | $37,600 | $166,600 |
| 2023 | $5,207 | $204,200 | $37,600 | $166,600 |
| 2022 | $3,669 | $128,760 | $15,280 | $113,480 |
| 2021 | $3,757 | $128,760 | $15,280 | $113,480 |
| 2020 | $3,480 | $146,160 | $15,280 | $130,880 |
| 2019 | $4,458 | $114,440 | $10,880 | $103,560 |
| 2018 | $3,488 | $114,440 | $10,880 | $103,560 |
| 2016 | $2,949 | $94,800 | $8,160 | $86,640 |
| 2015 | $3,719 | $94,800 | $8,160 | $86,640 |
| 2014 | -- | $42,640 | $8,000 | $34,640 |
Source: Public Records
Map
Nearby Homes
- 438 Langford Dr
- 5989 Kenn Manor Way
- 6092 Norcross Glen Trace
- 5969 Kenn Manor Way
- 465 Langford Dr
- 2810 Olde Town Park Dr Unit I
- 6095 Georgetown Park Dr Unit I
- 519 Holcomb Bridge Rd
- 5911 Brundage Ln
- 5934 Redwine St
- 6176 Eves Way
- 5960 Webster Cir
- 6056 Gaines St
- 250 W Peachtree St
- 782 Holcomb Bridge Rd
- 551 Sunset Dr
- 757 Sunset Dr
- 6050 Buford Hwy
- 76 Jones St
- 124 Parkside West Ct
- 413 Hunter St
- 455 Hunter St
- 367 Hunter St
- 334 Hunter St
- 6060 Hunter Hall Ct
- 496 Hunter St
- 6050 Hunter Hall Ct
- 330 Hunter St
- 6040 Hunter Hall Ct
- 6065 Hunter Hall Ct
- 465 Hunter St
- 6055 Hunter Hall Ct
- 6055 Hunter Hall Ct Unit 2
- 6032 Norcross Glen Trace Unit 6032
- 6032 Norcross Glen Trace
- 6032 Norcross Glen Trace Unit 1
- 6030 Hunter Hall Ct
- 6024 Norcross Glen Trace
- 6042 Norcross Glen Trace
- 326 Hunter St
Your Personal Tour Guide
Ask me questions while you tour the home.