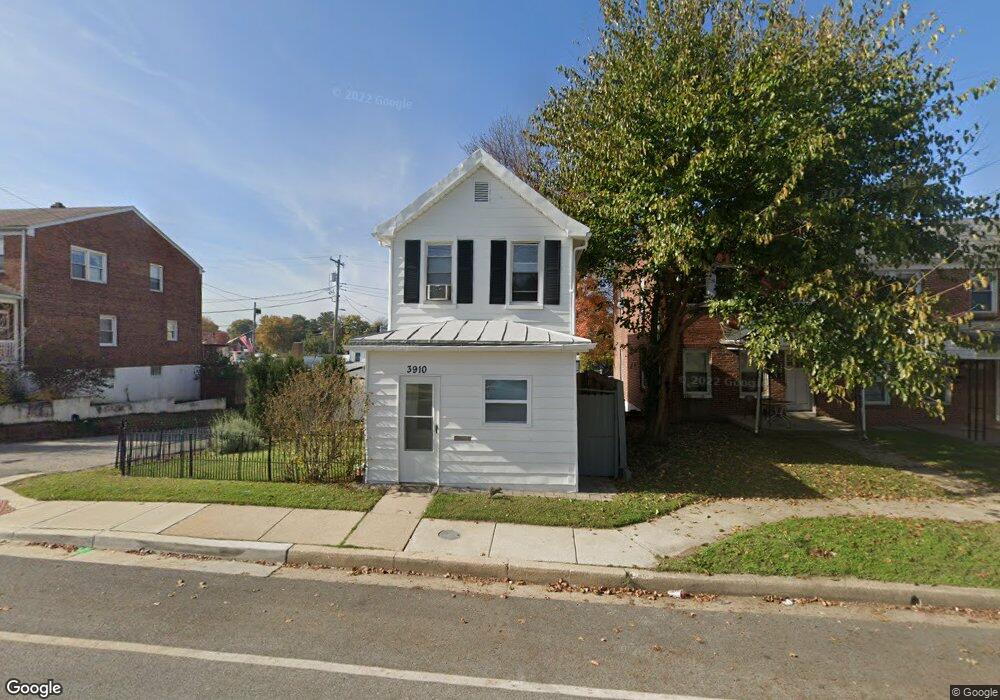
3910 2nd St Brooklyn, MD 21225
Estimated Value: $139,000 - $236,190
Studio
1
Bath
1,236
Sq Ft
$152/Sq Ft
Est. Value
About This Home
This home is located at 3910 2nd St, Brooklyn, MD 21225 and is currently estimated at $187,595, approximately $151 per square foot. 3910 2nd St is a home located in Baltimore City with nearby schools including Maree Garnett Farring Elementary School, Booker T. Washington Middle School, and Benjamin Franklin High School.
Ownership History
Date
Name
Owned For
Owner Type
Purchase Details
Closed on
May 18, 2018
Sold by
Holt Rodney
Bought by
Cobalt Properties Llc
Current Estimated Value
Home Financials for this Owner
Home Financials are based on the most recent Mortgage that was taken out on this home.
Original Mortgage
$46,750
Outstanding Balance
$40,253
Interest Rate
4.4%
Mortgage Type
Commercial
Estimated Equity
$147,342
Purchase Details
Closed on
Dec 15, 2005
Sold by
Viking Investments Inc
Bought by
Alvarez Carmen M
Purchase Details
Closed on
Mar 15, 2004
Sold by
Phillips Leon B
Bought by
Viking Investments Inc
Create a Home Valuation Report for This Property
The Home Valuation Report is an in-depth analysis detailing your home's value as well as a comparison with similar homes in the area
Home Values in the Area
Average Home Value in this Area
Purchase History
| Date | Buyer | Sale Price | Title Company |
|---|---|---|---|
| Cobalt Properties Llc | $55,000 | Perfection Title Ltd | |
| Alvarez Carmen M | $125,000 | -- | |
| Viking Investments Inc | $66,000 | -- |
Source: Public Records
Mortgage History
| Date | Status | Borrower | Loan Amount |
|---|---|---|---|
| Open | Cobalt Properties Llc | $46,750 |
Source: Public Records
Tax History
| Year | Tax Paid | Tax Assessment Tax Assessment Total Assessment is a certain percentage of the fair market value that is determined by local assessors to be the total taxable value of land and additions on the property. | Land | Improvement |
|---|---|---|---|---|
| 2025 | $2,788 | $140,700 | -- | -- |
| 2024 | $2,788 | $133,200 | -- | -- |
| 2023 | $2,718 | $125,700 | $37,800 | $87,900 |
| 2022 | $2,620 | $121,333 | $0 | $0 |
| 2021 | $2,760 | $116,967 | $0 | $0 |
| 2020 | $2,446 | $112,600 | $37,800 | $74,800 |
| 2019 | $2,370 | $112,600 | $37,800 | $74,800 |
| 2018 | $2,312 | $112,600 | $37,800 | $74,800 |
| 2017 | $2,234 | $122,800 | $0 | $0 |
| 2016 | $1,929 | $120,033 | $0 | $0 |
| 2015 | $1,929 | $117,267 | $0 | $0 |
| 2014 | $1,929 | $114,500 | $0 | $0 |
Source: Public Records
Map
Nearby Homes
Your Personal Tour Guide
Ask me questions while you tour the home.