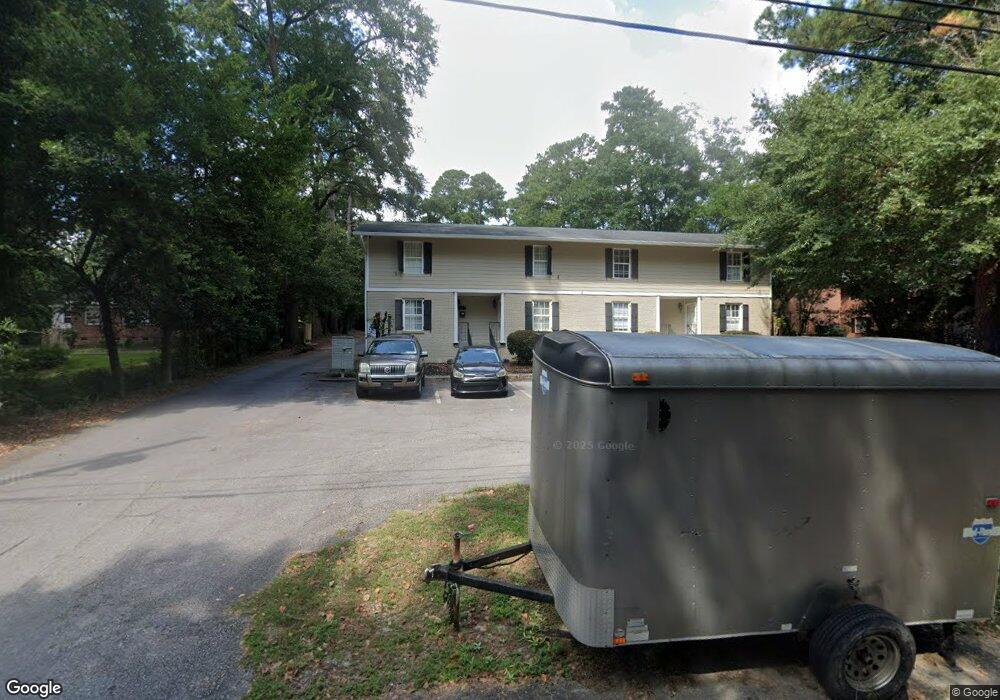
3913 Overbrook Dr Unit 2A Columbia, SC 29205
Rosewood NeighborhoodEstimated Value: $144,000 - $222,517
2
Beds
3
Baths
1,017
Sq Ft
$168/Sq Ft
Est. Value
About This Home
This home is located at 3913 Overbrook Dr Unit 2A, Columbia, SC 29205 and is currently estimated at $171,129, approximately $168 per square foot. 3913 Overbrook Dr Unit 2A is a home located in Richland County with nearby schools including South Kilbourne Elementary School, Hand Middle School, and Dreher High School.
Ownership History
Date
Name
Owned For
Owner Type
Purchase Details
Closed on
Sep 2, 2025
Sold by
3913 Overbrook Llc
Bought by
Hpt Llc
Current Estimated Value
Home Financials for this Owner
Home Financials are based on the most recent Mortgage that was taken out on this home.
Original Mortgage
$540,000
Outstanding Balance
$540,000
Interest Rate
6.74%
Mortgage Type
New Conventional
Estimated Equity
-$368,871
Purchase Details
Closed on
Dec 30, 2020
Sold by
Moustafa Moustafa A A
Bought by
3913 Overbrook Llc
Home Financials for this Owner
Home Financials are based on the most recent Mortgage that was taken out on this home.
Original Mortgage
$810,400
Interest Rate
2.7%
Mortgage Type
Purchase Money Mortgage
Purchase Details
Closed on
May 16, 2014
Sold by
South Edisto Development Llc
Bought by
Moustafa Moustafa A A
Home Financials for this Owner
Home Financials are based on the most recent Mortgage that was taken out on this home.
Original Mortgage
$378,000
Interest Rate
4.32%
Mortgage Type
New Conventional
Create a Home Valuation Report for This Property
The Home Valuation Report is an in-depth analysis detailing your home's value as well as a comparison with similar homes in the area
Home Values in the Area
Average Home Value in this Area
Purchase History
| Date | Buyer | Sale Price | Title Company |
|---|---|---|---|
| Hpt Llc | $1,625,000 | None Listed On Document | |
| 3913 Overbrook Llc | $830,000 | None Available | |
| 3913 Overbrook Llc | $830,000 | None Listed On Document | |
| Moustafa Moustafa A A | $540,000 | None Available |
Source: Public Records
Mortgage History
| Date | Status | Borrower | Loan Amount |
|---|---|---|---|
| Open | Hpt Llc | $540,000 | |
| Previous Owner | 3913 Overbrook Llc | $810,400 | |
| Previous Owner | Moustafa Moustafa A A | $378,000 |
Source: Public Records
Tax History
| Year | Tax Paid | Tax Assessment Tax Assessment Total Assessment is a certain percentage of the fair market value that is determined by local assessors to be the total taxable value of land and additions on the property. | Land | Improvement |
|---|---|---|---|---|
| 2024 | $2,464 | $95,000 | $0 | $0 |
| 2023 | $2,407 | $3,304 | $0 | $0 |
| 2022 | $2,211 | $82,600 | $17,200 | $65,400 |
| 2021 | $2,227 | $4,960 | $0 | $0 |
| 2020 | $1,869 | $4,140 | $0 | $0 |
| 2019 | $1,879 | $4,140 | $0 | $0 |
| 2018 | $1,651 | $3,600 | $0 | $0 |
| 2017 | $1,601 | $3,600 | $0 | $0 |
| 2016 | $1,570 | $3,600 | $0 | $0 |
| 2015 | $1,547 | $3,600 | $0 | $0 |
| 2014 | $1,514 | $60,000 | $0 | $0 |
| 2013 | -- | $4,850 | $0 | $0 |
Source: Public Records
Map
Nearby Homes
- 3921 Overbrook Dr Unit K
- 3921 Overbrook Dr Unit D
- 3850 Capers Ave
- 448 Deerwood St Unit 6F
- 448 Deerwood St Unit 6D
- 448 Deerwood St Unit 7A
- 448 Deerwood St Unit 5F
- 10 Magnolia Glen Ln
- 606 Hemphill St
- 612 S Beltline Blvd
- 403 Hemphill St
- 4105 Beecliff Dr
- 4125 Mikell Ln
- 746 Deerwood St
- 39 Cavalier Ct
- 320 S Beltline Blvd Unit 25-A
- 320 S Beltline Blvd Unit 4A
- 4057 Rosewood Dr
- 3947 Live Oak St
- 3963 Live Oak St
- 3913 Overbrook Dr Unit 3E
- 3913 Overbrook Dr Unit 3C
- 3913 Overbrook Dr Unit 3B
- 3913 Overbrook Dr Unit 3A
- 3913 Overbrook Dr Unit 3D
- 3913 Overbrook Dr
- 3913 Overbrook Dr Unit 1-D
- 3913 Overbrook Dr Unit 1-B
- 3913 Overbrook Dr Unit A
- 3913 Overbrook Dr
- 3913 Overbrook Dr
- 3913 Overbrook Dr
- 3913 Overbrook Dr
- 3913 Overbrook Dr
- 3913 Overbrook Dr Unit 3C
- 3913 Overbrook Dr Unit 1C
- 3913 Overbrook Dr Unit 3E
- 3913 Overbrook Dr Unit 3D
- 3913 Overbrook Dr Unit 3B
- 3913 Overbrook Dr Unit 2C
Your Personal Tour Guide
Ask me questions while you tour the home.