Estimated Value: $451,000 - $466,000
4
Beds
3
Baths
2,010
Sq Ft
$227/Sq Ft
Est. Value
About This Home
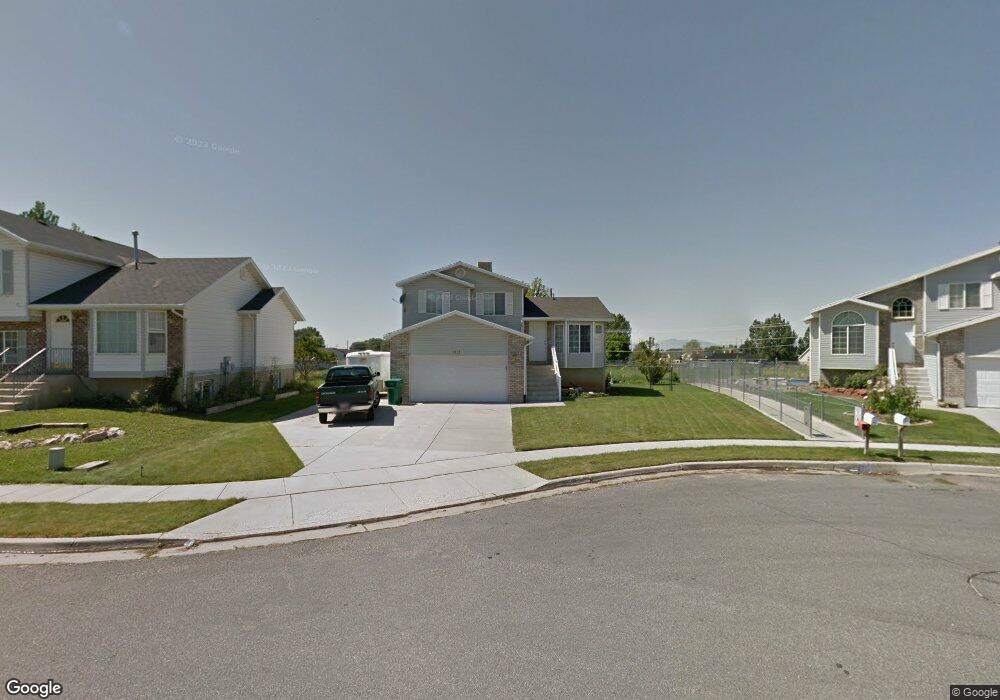
This home is located at 3917 S 2675 W, Roy, UT 84067 and is currently estimated at $456,806, approximately $227 per square foot. 3917 S 2675 W is a home located in Weber County with nearby schools including North Park School, Sand Ridge Junior High School, and Roy High School.
Ownership History
Date
Name
Owned For
Owner Type
Purchase Details
Closed on
Jan 24, 2020
Sold by
Marchand John P and Marchand Estelita L
Bought by
Dale Mccrary Llc
Current Estimated Value
Purchase Details
Closed on
Jun 20, 1997
Sold by
Haskell Homes Inc
Bought by
Marchand Ii John P
Home Financials for this Owner
Home Financials are based on the most recent Mortgage that was taken out on this home.
Original Mortgage
$116,621
Interest Rate
7.5%
Mortgage Type
VA
Create a Home Valuation Report for This Property
The Home Valuation Report is an in-depth analysis detailing your home's value as well as a comparison with similar homes in the area
Home Values in the Area
Average Home Value in this Area
Purchase History
| Date | Buyer | Sale Price | Title Company |
|---|---|---|---|
| Dale Mccrary Llc | -- | Mountain View Title Ogden | |
| Marchand Ii John P | -- | Security Title |
Source: Public Records
Mortgage History
| Date | Status | Borrower | Loan Amount |
|---|---|---|---|
| Previous Owner | Marchand Ii John P | $116,621 |
Source: Public Records
Tax History
| Year | Tax Paid | Tax Assessment Tax Assessment Total Assessment is a certain percentage of the fair market value that is determined by local assessors to be the total taxable value of land and additions on the property. | Land | Improvement |
|---|---|---|---|---|
| 2025 | $2,717 | $432,579 | $135,012 | $297,567 |
| 2024 | $2,601 | $416,000 | $135,012 | $280,988 |
| 2023 | $2,391 | $381,000 | $129,667 | $251,333 |
| 2022 | $2,716 | $451,000 | $110,001 | $340,999 |
| 2021 | $2,125 | $317,000 | $75,002 | $241,998 |
| 2020 | $2,139 | $295,000 | $75,002 | $219,998 |
| 2019 | $2,079 | $270,000 | $49,906 | $220,094 |
| 2018 | $1,907 | $232,000 | $44,976 | $187,024 |
| 2017 | $1,753 | $199,000 | $43,029 | $155,971 |
| 2016 | $1,706 | $104,233 | $24,773 | $79,460 |
| 2015 | $1,554 | $96,870 | $24,773 | $72,097 |
| 2014 | $1,486 | $91,154 | $21,944 | $69,210 |
Source: Public Records
Map
Nearby Homes
- 4020 Westlake Dr
- 3973 S 2900 W Unit 9A
- 2782 W 4140 S Unit 249
- 3750 S Midland Dr Unit 80
- 3750 S Midland Dr Unit 189
- 3750 S Midland Dr
- 3750 S Midland Dr Unit 34
- 2579 W 3900 S
- 2778 W 4175 S Unit 237
- 3922 S 2950 W
- 3931 S 2950 W
- 2877 W 4200 S
- 3860 Midland Dr Unit C10
- 3860 Midland Dr Unit C39
- 3860 Midland Dr Unit A18
- 2815 W 4275 S
- 3167 W 3725 S
- 2883 W 4275 S
- 3763 S 3175 W
- 3713 S 3175 W
Your Personal Tour Guide
Ask me questions while you tour the home.