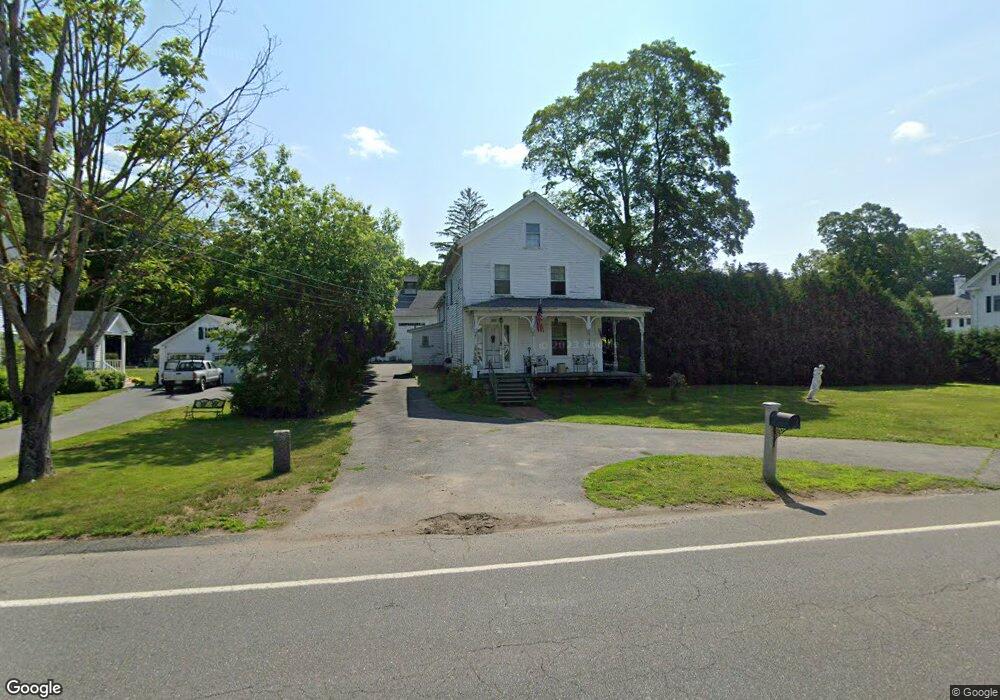
392 Main St Wilbraham, MA 01095
Estimated Value: $418,000 - $508,270
4
Beds
2
Baths
2,968
Sq Ft
$149/Sq Ft
Est. Value
About This Home
This home is located at 392 Main St, Wilbraham, MA 01095 and is currently estimated at $443,068, approximately $149 per square foot. 392 Main St is a home located in Hampden County with nearby schools including Minnechaug Regional High School, Springfield International Charter School, and Wilbraham & Monson Academy.
Ownership History
Date
Name
Owned For
Owner Type
Purchase Details
Closed on
Jun 29, 2001
Sold by
Hutchinson Dorothy Est
Bought by
Lee Harold C and Lee Sharon J
Current Estimated Value
Create a Home Valuation Report for This Property
The Home Valuation Report is an in-depth analysis detailing your home's value as well as a comparison with similar homes in the area
Home Values in the Area
Average Home Value in this Area
Purchase History
We collect this data history from publicly available records. To have your information removed, we recommend requesting removal directly through your county’s website.
| Date | Buyer | Sale Price | Title Company |
|---|---|---|---|
| Lee Harold C | $145,000 | -- | |
| Lee Harold C | $145,000 | -- |
Source: Public Records
Mortgage History
We collect this data history from publicly available records. To have your information removed, we recommend requesting removal directly through your county’s website.
| Date | Status | Borrower | Loan Amount |
|---|---|---|---|
| Open | Lee Harold C | $50,000 |
Source: Public Records
Tax History
| Year | Tax Paid | Tax Assessment Tax Assessment Total Assessment is a certain percentage of the fair market value that is determined by local assessors to be the total taxable value of land and additions on the property. | Land | Improvement |
|---|---|---|---|---|
| 2025 | $3,998 | $223,600 | $80,700 | $142,900 |
| 2024 | $5,765 | $311,600 | $80,700 | $230,900 |
| 2023 | $5,688 | $280,800 | $80,700 | $200,100 |
| 2022 | $5,688 | $277,600 | $80,700 | $196,900 |
| 2021 | $5,177 | $225,500 | $86,400 | $139,100 |
| 2020 | $5,047 | $225,500 | $86,400 | $139,100 |
| 2019 | $4,916 | $225,500 | $86,400 | $139,100 |
| 2018 | $4,836 | $213,600 | $86,400 | $127,200 |
| 2017 | $4,699 | $213,600 | $86,400 | $127,200 |
| 2016 | $4,895 | $226,600 | $96,100 | $130,500 |
| 2015 | $4,731 | $226,600 | $96,100 | $130,500 |
Source: Public Records
Map
Nearby Homes
- 20 Arbor Ln
- 474 Mountain Rd
- 6 Blueberry Hill Rd
- 8 Bittersweet Ln
- 459 Mountain Rd
- 7 Highridge Rd
- 474-480 Mountain Rd
- 100 High Pine Cir
- 751 Ridge Rd
- 24 Merrill Rd
- 10 Cadwell Dr
- 717-719 Stony Hill Rd
- 46 Washington Rd
- 767 Stony Hill Rd
- 763 Stony Hill Rd
- 107 Sandalwood Dr
- 15 Cedar Ridge Dr Unit 1
- 5v Red Gap Rd
- 56 Cherry Dr Unit 56
- 16 Falcon Heights
Your Personal Tour Guide
Ask me questions while you tour the home.