393 Collins Rd Toccoa, GA 30577
Estimated Value: $161,000 - $180,895
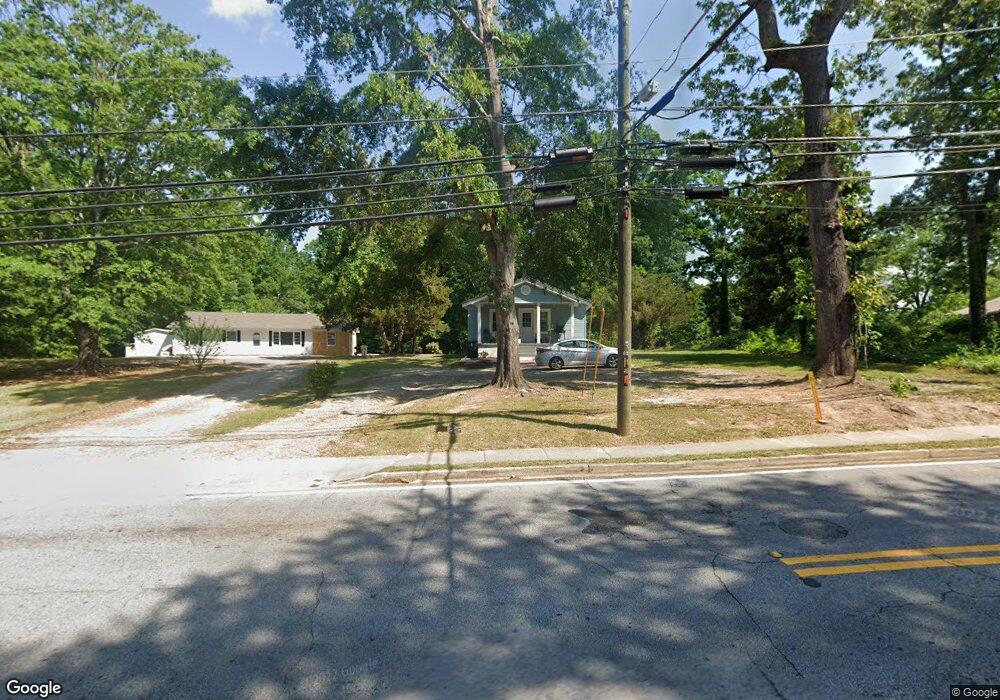
About This Home
This home is located at 393 Collins Rd, Toccoa, GA 30577 and is currently estimated at $171,224, approximately $180 per square foot. 393 Collins Rd is a home located in Stephens County with nearby schools including Stephens County High School.
Ownership History
We collect this data history from publicly available records. To have your information removed, we recommend requesting removal directly through your county’s website.
Purchase Details
Home Financials for this Owner
Home Financials are based on the most recent Mortgage that was taken out on this home.Purchase Details
Purchase Details
Purchase Details
Purchase Details
Purchase History
We collect this data history from publicly available records. To have your information removed, we recommend requesting removal directly through your county’s website.
| Date | Buyer | Sale Price | Title Company |
|---|---|---|---|
| $74,350 | -- | ||
| -- | -- | ||
| -- | -- | ||
| $33,000 | -- | ||
| $32,000 | -- |
Mortgage History
We collect this data history from publicly available records. To have your information removed, we recommend requesting removal directly through your county’s website.
| Date | Status | Borrower | Loan Amount |
|---|---|---|---|
| Open | $75,101 |
Tax History
We collect this data history from publicly available records. To have your information removed, we recommend requesting removal directly through your county’s website.
| Year | Tax Paid | Tax Assessment Tax Assessment Total Assessment is a certain percentage of the fair market value that is determined by local assessors to be the total taxable value of land and additions on the property. | Land | Improvement |
|---|---|---|---|---|
| 2025 | $1,794 | $51,409 | $1,473 | $49,936 |
| 2024 | $1,174 | $32,937 | $1,473 | $31,464 |
| 2023 | $1,078 | $30,491 | $1,473 | $29,018 |
| 2022 | $850 | $28,550 | $1,473 | $27,077 |
| 2021 | $822 | $26,276 | $1,473 | $24,803 |
| 2020 | $788 | $24,949 | $1,473 | $23,476 |
| 2019 | $254 | $8,013 | $1,473 | $6,540 |
| 2018 | $254 | $8,013 | $1,473 | $6,540 |
| 2017 | $258 | $8,013 | $1,473 | $6,540 |
| 2016 | $254 | $8,012 | $1,472 | $6,540 |
| 2015 | $263 | $7,926 | $1,472 | $6,453 |
| 2014 | $268 | $7,926 | $1,473 | $6,454 |
| 2013 | -- | $10,432 | $1,472 | $8,960 |
Map
- 389 Collins Rd
- 481 Collins Rd
- 99 Hilltop Ln
- 0 Hilltop Ln Unit 10728713
- 586 Collins Rd
- 185 Stancil Dr
- 239 Stancil Dr
- 211 Hilltop Ln
- 122 King St
- 128 Branch St
- 317 Stancil Dr
- 500 S Pond St
- 478 S Pond St
- 181 Forest Ave
- 0 Valley Dr Unit 7751789
- 0 Valley Dr Unit 10701357
- 93 Hickory Cir
- 0 Stephen Dr Unit 10710969
- 0 Stephen Dr Unit 10710891
- 320 S Pond St
Ask me questions while you tour the home.