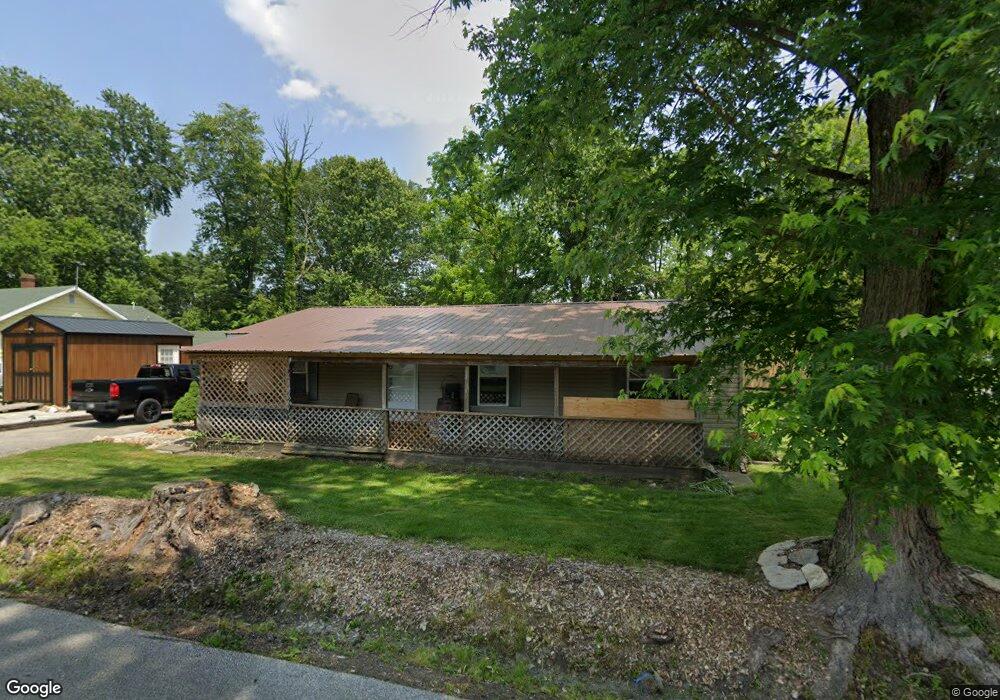
393 S 3rd St Austin, IN 47102
Estimated Value: $120,000 - $152,000
3
Beds
2
Baths
1,080
Sq Ft
$123/Sq Ft
Est. Value
About This Home
This home is located at 393 S 3rd St, Austin, IN 47102 and is currently estimated at $132,365, approximately $122 per square foot. 393 S 3rd St is a home with nearby schools including Austin Elementary School, Austin Middle School, and Austin High School.
Ownership History
Date
Name
Owned For
Owner Type
Purchase Details
Closed on
Apr 21, 2017
Sold by
Bishop Brian D
Bought by
Bishop Brian D and Bishop Irene
Current Estimated Value
Purchase Details
Closed on
Dec 22, 2005
Sold by
Melton Vernon
Bought by
Bishop Brian D
Home Financials for this Owner
Home Financials are based on the most recent Mortgage that was taken out on this home.
Original Mortgage
$51,765
Outstanding Balance
$28,335
Interest Rate
6.42%
Mortgage Type
FHA
Estimated Equity
$104,030
Purchase Details
Closed on
Jul 12, 2005
Sold by
Cit Group Consumer Finance Inc
Bought by
Melton Vernon
Create a Home Valuation Report for This Property
The Home Valuation Report is an in-depth analysis detailing your home's value as well as a comparison with similar homes in the area
Home Values in the Area
Average Home Value in this Area
Purchase History
| Date | Buyer | Sale Price | Title Company |
|---|---|---|---|
| Bishop Brian D | -- | None Available | |
| Bishop Brian D | -- | Archer Land Title | |
| Melton Vernon | -- | None Available |
Source: Public Records
Mortgage History
| Date | Status | Borrower | Loan Amount |
|---|---|---|---|
| Open | Bishop Brian D | $51,765 |
Source: Public Records
Tax History
| Year | Tax Paid | Tax Assessment Tax Assessment Total Assessment is a certain percentage of the fair market value that is determined by local assessors to be the total taxable value of land and additions on the property. | Land | Improvement |
|---|---|---|---|---|
| 2025 | $429 | $50,500 | $6,500 | $44,000 |
| 2024 | $429 | $50,200 | $6,500 | $43,700 |
| 2023 | $418 | $51,200 | $6,500 | $44,700 |
| 2022 | $332 | $53,000 | $6,500 | $46,500 |
| 2021 | $312 | $50,700 | $6,500 | $44,200 |
| 2020 | $326 | $50,700 | $6,500 | $44,200 |
| 2019 | $298 | $48,600 | $6,500 | $42,100 |
| 2018 | $287 | $48,100 | $6,500 | $41,600 |
| 2017 | $277 | $48,600 | $6,500 | $42,100 |
| 2016 | $300 | $51,400 | $6,500 | $44,900 |
| 2014 | $303 | $51,200 | $5,200 | $46,000 |
| 2013 | $303 | $51,200 | $5,200 | $46,000 |
Source: Public Records
Map
Nearby Homes
Your Personal Tour Guide
Ask me questions while you tour the home.