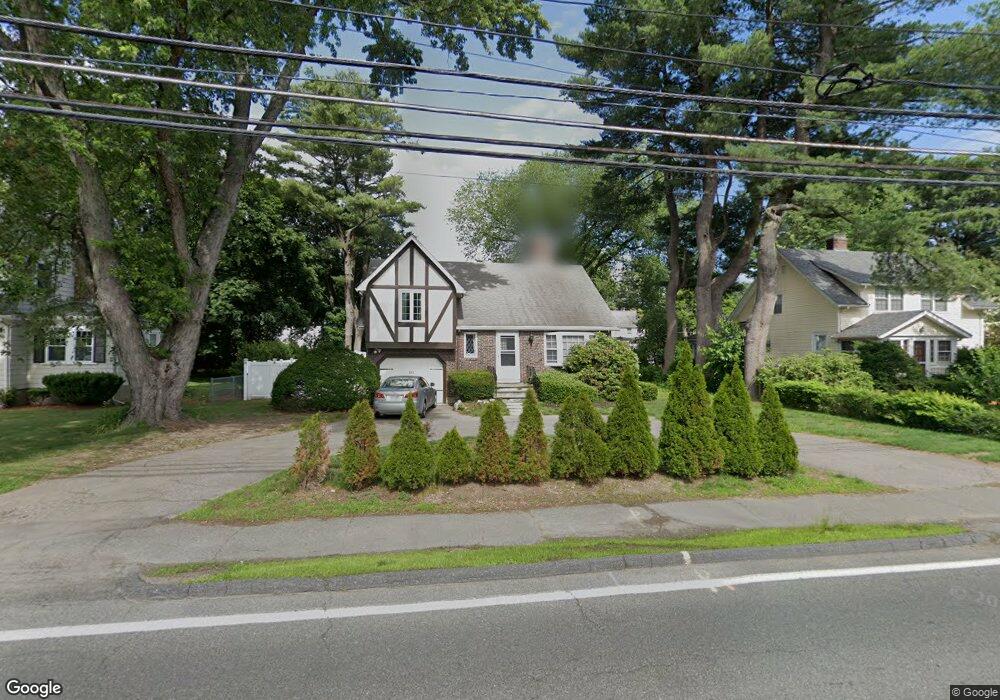
393 Weston Rd Wellesley, MA 02482
Estimated Value: $981,000 - $1,309,000
3
Beds
2
Baths
1,218
Sq Ft
$966/Sq Ft
Est. Value
About This Home
This home is located at 393 Weston Rd, Wellesley, MA 02482 and is currently estimated at $1,176,328, approximately $965 per square foot. 393 Weston Rd is a home located in Norfolk County with nearby schools including Katharine Lee Bates Elementary School, Wellesley Middle School, and Wellesley Sr High School.
Ownership History
Date
Name
Owned For
Owner Type
Purchase Details
Closed on
Nov 8, 2004
Sold by
Ghadar Fariborz
Bought by
Yee Beverly and Yee William
Current Estimated Value
Home Financials for this Owner
Home Financials are based on the most recent Mortgage that was taken out on this home.
Original Mortgage
$450,000
Outstanding Balance
$223,517
Interest Rate
5.71%
Mortgage Type
Purchase Money Mortgage
Estimated Equity
$952,811
Create a Home Valuation Report for This Property
The Home Valuation Report is an in-depth analysis detailing your home's value as well as a comparison with similar homes in the area
Purchase History
| Date | Buyer | Sale Price | Title Company |
|---|---|---|---|
| Yee Beverly | $610,000 | -- |
Source: Public Records
Mortgage History
| Date | Status | Borrower | Loan Amount |
|---|---|---|---|
| Open | Yee Beverly | $450,000 | |
| Closed | Yee Beverly | $50,000 |
Source: Public Records
Tax History
| Year | Tax Paid | Tax Assessment Tax Assessment Total Assessment is a certain percentage of the fair market value that is determined by local assessors to be the total taxable value of land and additions on the property. | Land | Improvement |
|---|---|---|---|---|
| 2025 | $10,527 | $1,024,000 | $926,000 | $98,000 |
| 2024 | $9,369 | $900,000 | $805,000 | $95,000 |
| 2023 | $9,068 | $792,000 | $721,000 | $71,000 |
| 2022 | $8,853 | $758,000 | $618,000 | $140,000 |
| 2021 | $8,907 | $758,000 | $618,000 | $140,000 |
| 2020 | $8,762 | $758,000 | $618,000 | $140,000 |
| 2019 | $8,770 | $758,000 | $618,000 | $140,000 |
| 2018 | $8,281 | $693,000 | $612,000 | $81,000 |
| 2017 | $8,170 | $693,000 | $612,000 | $81,000 |
| 2016 | $8,056 | $681,000 | $602,000 | $79,000 |
| 2015 | $7,422 | $642,000 | $568,000 | $74,000 |
Source: Public Records
Map
Nearby Homes
- 2 Cavanagh Rd
- 23 Pilgrim Rd
- 27 Garrison Rd
- 20 Parker Rd
- 5 Wilde Rd
- 53 Elmwood Rd
- 6 Boulder Brook Rd
- 38 Parker Rd
- 339 Weston Rd
- 31 Martin Rd
- 53 Chesterton Rd
- 90 Elmwood Rd
- 851 Worcester St
- 12 Russell Rd Unit 404
- 19 Northgate Rd
- 925 Worcester St
- 25 Mansfield Rd
- 15 Rockport Rd
- 8 Oakdale Ave
- 6 Meadowbrook Rd
Your Personal Tour Guide
Ask me questions while you tour the home.