394 Main St Newington, CT 06111
Estimated Value: $359,811 - $404,000
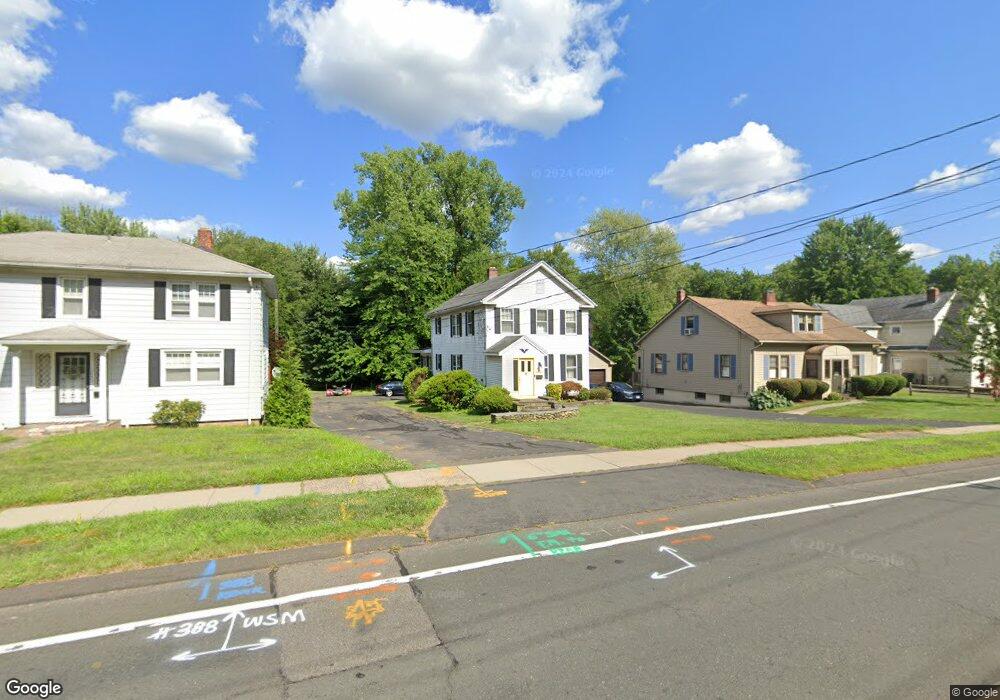
About This Home
This home is located at 394 Main St, Newington, CT 06111 and is currently estimated at $389,953, approximately $225 per square foot. 394 Main St is a home located in Hartford County with nearby schools including Elizabeth Green School, Martin Kellogg Middle School, and Newington High School.
Ownership History
We collect this data history from publicly available records. To have your information removed, we recommend requesting removal directly through your county’s website.
Purchase Details
Home Financials for this Owner
Home Financials are based on the most recent Mortgage that was taken out on this home.Purchase Details
Home Values in the Area
Average Home Value in this Area
Purchase History
We collect this data history from publicly available records. To have your information removed, we recommend requesting removal directly through your county’s website.
| Date | Buyer | Sale Price | Title Company |
|---|---|---|---|
| $175,000 | -- | ||
| $6,500 | -- |
Mortgage History
We collect this data history from publicly available records. To have your information removed, we recommend requesting removal directly through your county’s website.
| Date | Status | Borrower | Loan Amount |
|---|---|---|---|
| Open | $152,000 | ||
| Closed | $155,000 |
Tax History
We collect this data history from publicly available records. To have your information removed, we recommend requesting removal directly through your county’s website.
| Year | Tax Paid | Tax Assessment Tax Assessment Total Assessment is a certain percentage of the fair market value that is determined by local assessors to be the total taxable value of land and additions on the property. | Land | Improvement |
|---|---|---|---|---|
| 2025 | $4,728 | $118,260 | $52,960 | $65,300 |
| 2024 | $4,691 | $118,260 | $52,960 | $65,300 |
| 2023 | $4,536 | $118,260 | $52,960 | $65,300 |
| 2022 | $4,552 | $118,260 | $52,960 | $65,300 |
| 2021 | $4,590 | $118,260 | $52,960 | $65,300 |
| 2020 | $4,591 | $116,870 | $50,920 | $65,950 |
| 2019 | $4,611 | $116,870 | $50,920 | $65,950 |
| 2018 | $4,499 | $116,870 | $50,920 | $65,950 |
| 2017 | $4,276 | $116,870 | $50,920 | $65,950 |
| 2016 | $4,178 | $116,870 | $50,920 | $65,950 |
| 2014 | $4,711 | $135,480 | $51,370 | $84,110 |
Map
- 29 Millbrook Ct
- 43 Millbrook Ct Unit 43
- 65 Harding Ave
- 34 Carriage Hill Dr
- 179 Moylan Ct
- 140 Camp Ave
- 117 Gilbert Rd
- 38 Cedar Ridge Rd
- 104 Sunset Rd
- 5 Dalewood Rd
- 402 Connecticut Ave
- 150 Fisk Dr
- 39 Putnam St
- 23 Francis Ave
- 112 Brentwood Rd
- 461 Mountain Rd
- 252 Willard Ave
- 564 Willard Ave
- 14 Center Ct
- 22 Main St
Ask me questions while you tour the home.