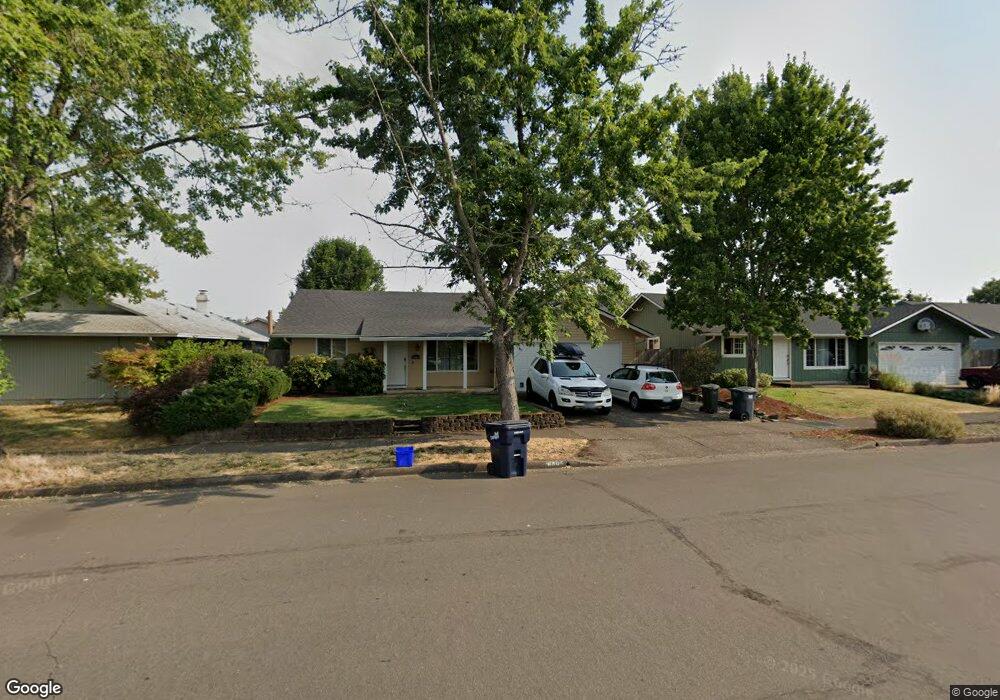
3943 Josh St Eugene, OR 97402
Churchill NeighborhoodEstimated Value: $399,000 - $403,000
3
Beds
2
Baths
1,267
Sq Ft
$317/Sq Ft
Est. Value
About This Home
This home is located at 3943 Josh St, Eugene, OR 97402 and is currently estimated at $401,533, approximately $316 per square foot. 3943 Josh St is a home located in Lane County with nearby schools including Twin Oaks Elementary School, Kennedy Middle School, and Churchill High School.
Ownership History
Date
Name
Owned For
Owner Type
Purchase Details
Closed on
Feb 8, 2007
Sold by
Klinect Bryan
Bought by
Miles John and Campbell Christina E
Current Estimated Value
Home Financials for this Owner
Home Financials are based on the most recent Mortgage that was taken out on this home.
Original Mortgage
$21,000
Interest Rate
5.91%
Mortgage Type
Stand Alone Second
Purchase Details
Closed on
Sep 21, 2006
Sold by
Klinect Abigail A
Bought by
Klinect Bryan
Purchase Details
Closed on
Feb 27, 2003
Sold by
Martinez Louie E and Martinez Patricia
Bought by
Klinect Bryan B and Klinect Abigail A
Home Financials for this Owner
Home Financials are based on the most recent Mortgage that was taken out on this home.
Original Mortgage
$138,132
Interest Rate
5.93%
Mortgage Type
FHA
Create a Home Valuation Report for This Property
The Home Valuation Report is an in-depth analysis detailing your home's value as well as a comparison with similar homes in the area
Home Values in the Area
Average Home Value in this Area
Purchase History
| Date | Buyer | Sale Price | Title Company |
|---|---|---|---|
| Miles John | $210,000 | Cascade Title Co | |
| Klinect Bryan | -- | None Available | |
| Klinect Bryan B | $140,300 | Western Pioneer Title Co |
Source: Public Records
Mortgage History
| Date | Status | Borrower | Loan Amount |
|---|---|---|---|
| Closed | Miles John | $21,000 | |
| Open | Miles John | $168,000 | |
| Previous Owner | Klinect Bryan B | $138,132 |
Source: Public Records
Tax History
| Year | Tax Paid | Tax Assessment Tax Assessment Total Assessment is a certain percentage of the fair market value that is determined by local assessors to be the total taxable value of land and additions on the property. | Land | Improvement |
|---|---|---|---|---|
| 2025 | $3,889 | $199,592 | -- | -- |
| 2024 | $3,840 | $193,779 | -- | -- |
| 2023 | $3,840 | $188,135 | $0 | $0 |
| 2022 | $3,598 | $182,656 | $0 | $0 |
| 2021 | $3,379 | $177,336 | $0 | $0 |
| 2020 | $3,391 | $172,171 | $0 | $0 |
| 2019 | $3,275 | $167,157 | $0 | $0 |
| 2018 | $3,083 | $157,562 | $0 | $0 |
| 2017 | $2,945 | $157,562 | $0 | $0 |
| 2016 | $2,872 | $152,973 | $0 | $0 |
| 2015 | $2,753 | $148,517 | $0 | $0 |
| 2014 | $2,701 | $144,191 | $0 | $0 |
Source: Public Records
Map
Nearby Homes
- 3958 Pam St
- 1415 S Bertelsen Rd Unit 96
- 1415 S Bertelsen Rd Unit 34
- 1415 S Bertelsen Rd Unit 143
- 1625 S Bertelsen Rd
- 1885 Churchill St
- 3826 Peppertree Dr
- 1925 Harvard Dr
- 3705 Peppertree Dr
- 1980 Princeton Dr
- 3534 Westleigh St
- 3823 Wilshire Ln
- 1438 Quaker St
- 1326 Quaker St
- 1580 Brittany St
- 3315 W 18th Ave
- 3899 Colony Oaks Dr
- 3809 Colony Oaks Dr
- 2842 Greentree Way
- 4048 Eagle View Dr
Your Personal Tour Guide
Ask me questions while you tour the home.