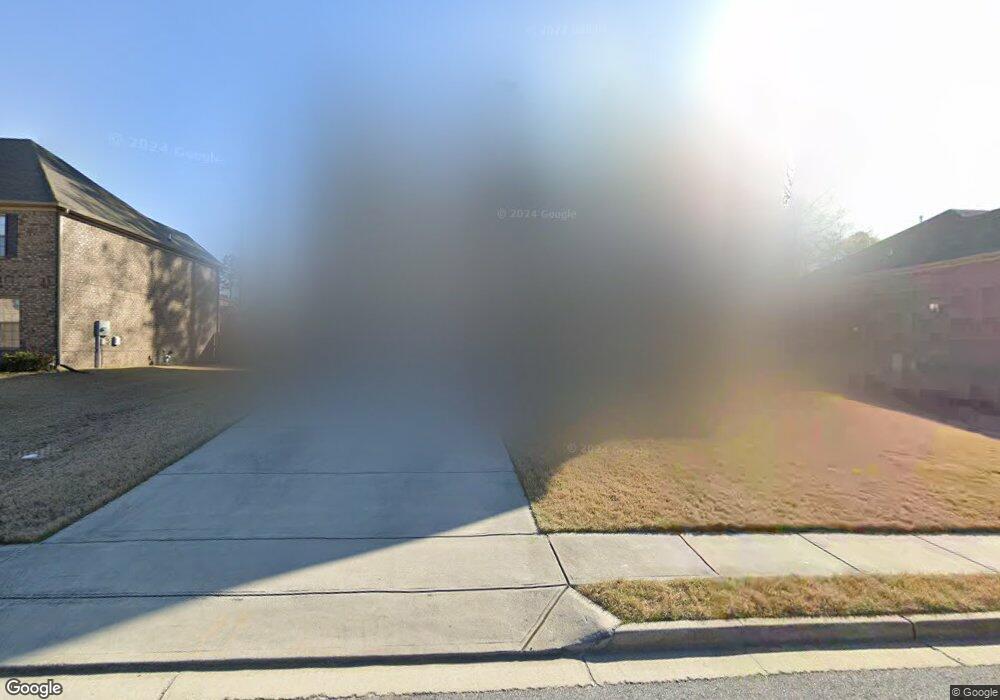
396 Dunaway Ct Grayson, GA 30017
Estimated Value: $538,204 - $617,000
About This Home
This home is located at 396 Dunaway Ct, Grayson, GA 30017 and is currently estimated at $593,801, approximately $144 per square foot. 396 Dunaway Ct is a home with nearby schools including Starling Elementary School, Couch Middle School, and Grayson High School.
Ownership History
We collect this data history from publicly available records. To have your information removed, we recommend requesting removal directly through your county’s website.
Purchase Details
Purchase Details
Purchase Details
Home Values in the Area
Average Home Value in this Area
Purchase History
We collect this data history from publicly available records. To have your information removed, we recommend requesting removal directly through your county’s website.
| Date | Buyer | Sale Price | Title Company |
|---|---|---|---|
| -- | -- | ||
| -- | -- | ||
| $330,630 | -- |
Tax History
We collect this data history from publicly available records. To have your information removed, we recommend requesting removal directly through your county’s website.
| Year | Tax Paid | Tax Assessment Tax Assessment Total Assessment is a certain percentage of the fair market value that is determined by local assessors to be the total taxable value of land and additions on the property. | Land | Improvement |
|---|---|---|---|---|
| 2025 | $6,861 | $227,400 | $30,000 | $197,400 |
| 2024 | $7,025 | $238,600 | $30,000 | $208,600 |
| 2023 | $7,025 | $233,440 | $40,000 | $193,440 |
| 2022 | $5,075 | $143,200 | $27,200 | $116,000 |
| 2021 | $4,893 | $143,200 | $27,200 | $116,000 |
| 2020 | $5,209 | $147,840 | $27,200 | $120,640 |
| 2019 | $5,210 | $147,840 | $27,200 | $120,640 |
| 2018 | $5,442 | $147,840 | $27,200 | $120,640 |
Map
- 1660 Rosemist Trail
- 445 Brackin Trace
- 1901 Mcconnell Rd
- 488 Townsend St
- 559 Bishopton St
- 239 Sweet Cane Trail
- 1425 Willow River Run
- 419 Bishopton St SE
- 1686 Mcconnell Rd SE
- 1688 Mcconnell Rd SE
- 14 Green Love Ln
- 104 Green Love Ln
- 1680 Mcconnell Rd SE
- 1682 Mcconnell Rd SE
- 1684 Mcconnell Rd SE
- 577 Barlow Place
- 532 Barlow Place
- 1421 Sutters Dr
- 145 Millennial Ct
- 1398 Gates Mill Walk
- 447 Dunaway Ct Unit 58
- 447 Dunaway Ct
- 457 Dunaway Ct Unit 57
- 457 Dunaway Ct
- 397 Dunaway Ct
- 467 Dunaway Ct Unit 56
- 467 Dunaway Ct
- 416 Dunaway Ct
- 446 Dunaway Ct Unit 82
- 446 Dunaway Ct
- 387 Dunaway Ct Unit 60
- 387 Dunaway Ct
- 436 Dunaway Ct Unit 152
- 436 Dunaway Ct Unit 81
- 436 Dunaway Ct
- 456 Dunaway Ct
- 426 Dunaway Ct
- 386 Dunaway Ct
- 477 Dunaway Ct Unit 55
- 477 Dunaway Ct
Ask me questions while you tour the home.