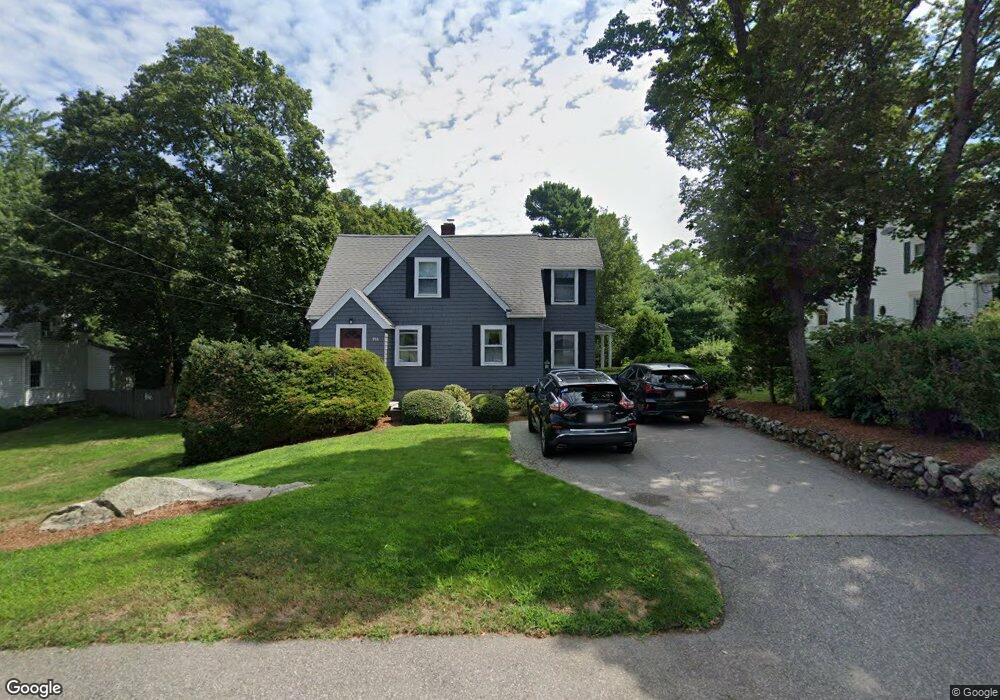
396 Front St Weymouth, MA 02188
Weymouth Landing NeighborhoodEstimated Value: $671,000 - $783,000
4
Beds
3
Baths
2,368
Sq Ft
$305/Sq Ft
Est. Value
About This Home
This home is located at 396 Front St, Weymouth, MA 02188 and is currently estimated at $723,056, approximately $305 per square foot. 396 Front St is a home located in Norfolk County with nearby schools including Frederick C Murphy, Abigail Adams Middle School, and Weymouth Middle School Chapman.
Ownership History
Date
Name
Owned For
Owner Type
Purchase Details
Closed on
Mar 5, 1975
Bought by
Branca William J and Branca Maureen
Current Estimated Value
Create a Home Valuation Report for This Property
The Home Valuation Report is an in-depth analysis detailing your home's value as well as a comparison with similar homes in the area
Home Values in the Area
Average Home Value in this Area
Purchase History
We collect this data history from publicly available records. To have your information removed, we recommend requesting removal directly through your county’s website.
| Date | Buyer | Sale Price | Title Company |
|---|---|---|---|
| Branca William J | $30,000 | -- |
Source: Public Records
Mortgage History
We collect this data history from publicly available records. To have your information removed, we recommend requesting removal directly through your county’s website.
| Date | Status | Borrower | Loan Amount |
|---|---|---|---|
| Open | Branca William J | $165,000 | |
| Closed | Branca William J | $50,000 | |
| Closed | Branca William J | $83,000 |
Source: Public Records
Tax History
| Year | Tax Paid | Tax Assessment Tax Assessment Total Assessment is a certain percentage of the fair market value that is determined by local assessors to be the total taxable value of land and additions on the property. | Land | Improvement |
|---|---|---|---|---|
| 2025 | $5,945 | $588,600 | $220,000 | $368,600 |
| 2024 | $5,760 | $560,900 | $209,500 | $351,400 |
| 2023 | $5,569 | $532,900 | $194,000 | $338,900 |
| 2022 | $5,418 | $472,800 | $179,700 | $293,100 |
| 2021 | $5,152 | $438,800 | $179,700 | $259,100 |
| 2020 | $5,022 | $421,300 | $179,700 | $241,600 |
| 2019 | $4,996 | $412,200 | $172,800 | $239,400 |
| 2018 | $4,834 | $386,700 | $164,500 | $222,200 |
| 2017 | $4,578 | $357,400 | $156,700 | $200,700 |
| 2016 | $4,399 | $343,700 | $150,700 | $193,000 |
| 2015 | $4,285 | $332,200 | $150,700 | $181,500 |
| 2014 | $4,103 | $308,500 | $140,200 | $168,300 |
Source: Public Records
Map
Nearby Homes
- 229 Summer St
- 40 Kingman St
- 80 Kensington Rd
- 43 Aster Cir
- 114 Meredith Way
- 33 Hunt St
- 3 Nob Hill Rd
- 19 Essex Heights Dr
- 61 Broad St
- 50 Sherricks Farm Rd
- 377 Summer St
- 215 Winter St Unit 1F
- 38 Stonewood Ln
- 12 Franklin St
- 437 Summer St
- 774 Middle St
- 40 Bell Rd
- 8 Tara Dr Unit 7
- 5 Tara Dr Unit 5
- 2 Tara Dr Unit 11
Your Personal Tour Guide
Ask me questions while you tour the home.