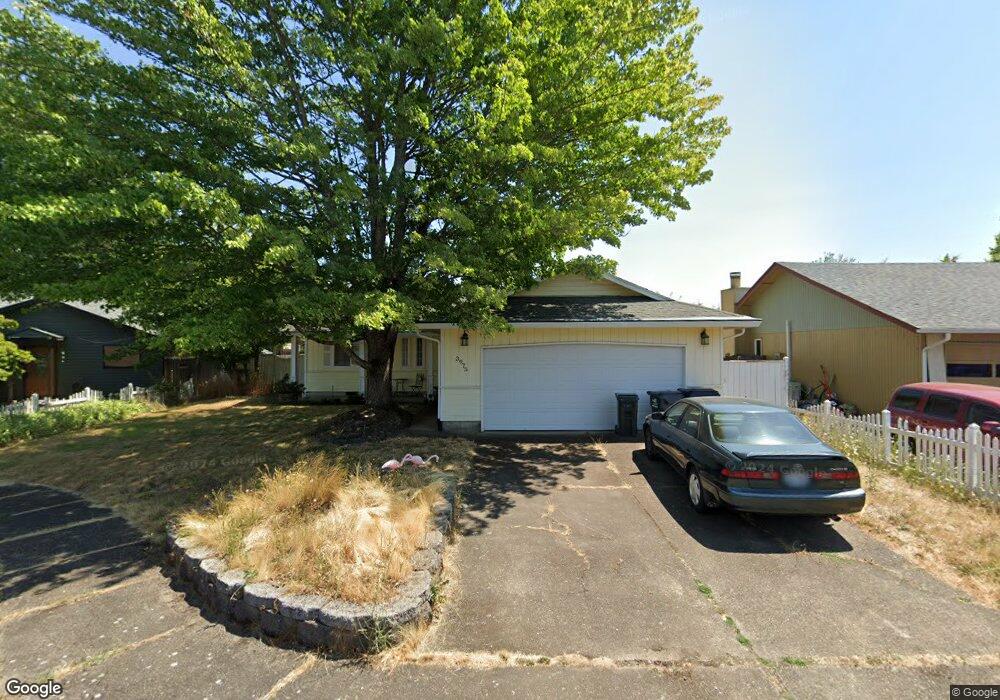
3975 Josh St Eugene, OR 97402
Churchill NeighborhoodEstimated Value: $379,000 - $399,000
3
Beds
2
Baths
1,190
Sq Ft
$328/Sq Ft
Est. Value
About This Home
This home is located at 3975 Josh St, Eugene, OR 97402 and is currently estimated at $390,258, approximately $327 per square foot. 3975 Josh St is a home located in Lane County with nearby schools including Twin Oaks Elementary School, Kennedy Middle School, and Churchill High School.
Ownership History
Date
Name
Owned For
Owner Type
Purchase Details
Closed on
Oct 14, 2015
Sold by
Wakeman Walter and Wakeman Yahsolait
Bought by
Wakeman Walter
Current Estimated Value
Home Financials for this Owner
Home Financials are based on the most recent Mortgage that was taken out on this home.
Original Mortgage
$159,200
Outstanding Balance
$124,827
Interest Rate
3.86%
Mortgage Type
New Conventional
Estimated Equity
$265,431
Purchase Details
Closed on
Mar 7, 2013
Sold by
Determan Jacqueline L
Bought by
Wakeman Walker and Wakeman Yahsolait
Home Financials for this Owner
Home Financials are based on the most recent Mortgage that was taken out on this home.
Original Mortgage
$162,450
Interest Rate
3.4%
Mortgage Type
New Conventional
Purchase Details
Closed on
Aug 15, 2007
Sold by
Determan Randy B and Determan Jacqueline L
Bought by
Determan Jacqueline L
Home Financials for this Owner
Home Financials are based on the most recent Mortgage that was taken out on this home.
Original Mortgage
$140,000
Interest Rate
6.74%
Mortgage Type
Purchase Money Mortgage
Create a Home Valuation Report for This Property
The Home Valuation Report is an in-depth analysis detailing your home's value as well as a comparison with similar homes in the area
Home Values in the Area
Average Home Value in this Area
Purchase History
| Date | Buyer | Sale Price | Title Company |
|---|---|---|---|
| Wakeman Walter | -- | Fidelity Natl Title Co Of Or | |
| Wakeman Walker | $171,000 | Western Title & Escrow Co | |
| Determan Jacqueline L | $56,900 | None Available |
Source: Public Records
Mortgage History
| Date | Status | Borrower | Loan Amount |
|---|---|---|---|
| Open | Wakeman Walter | $159,200 | |
| Closed | Wakeman Walker | $162,450 | |
| Previous Owner | Determan Jacqueline L | $140,000 |
Source: Public Records
Tax History
| Year | Tax Paid | Tax Assessment Tax Assessment Total Assessment is a certain percentage of the fair market value that is determined by local assessors to be the total taxable value of land and additions on the property. | Land | Improvement |
|---|---|---|---|---|
| 2025 | $3,760 | $192,957 | -- | -- |
| 2024 | $3,713 | $187,337 | -- | -- |
| 2023 | $3,713 | $181,881 | $0 | $0 |
| 2022 | $3,478 | $176,584 | $0 | $0 |
| 2021 | $3,267 | $171,441 | $0 | $0 |
| 2020 | $3,278 | $166,448 | $0 | $0 |
| 2019 | $3,166 | $161,600 | $0 | $0 |
| 2018 | $2,980 | $152,324 | $0 | $0 |
| 2017 | $2,847 | $152,324 | $0 | $0 |
| 2016 | $2,736 | $147,887 | $0 | $0 |
| 2015 | $2,611 | $143,580 | $0 | $0 |
| 2014 | $2,568 | $139,398 | $0 | $0 |
Source: Public Records
Map
Nearby Homes
- 3958 Pam St
- 1415 S Bertelsen Rd Unit 96
- 1415 S Bertelsen Rd Unit 34
- 1415 S Bertelsen Rd Unit 143
- 1625 S Bertelsen Rd
- 3826 Peppertree Dr
- 1885 Churchill St
- 1925 Harvard Dr
- 3705 Peppertree Dr
- 1980 Princeton Dr
- 3534 Westleigh St
- 1438 Quaker St
- 1326 Quaker St
- 3823 Wilshire Ln
- 1580 Brittany St
- 3315 W 18th Ave
- 3899 Colony Oaks Dr
- 0 Wallis St Unit 19292181
- 3379 S Lambert St
- 4048 Eagle View Dr
Your Personal Tour Guide
Ask me questions while you tour the home.