398 High St Pembroke, MA 02359
Estimated Value: $504,000 - $622,000
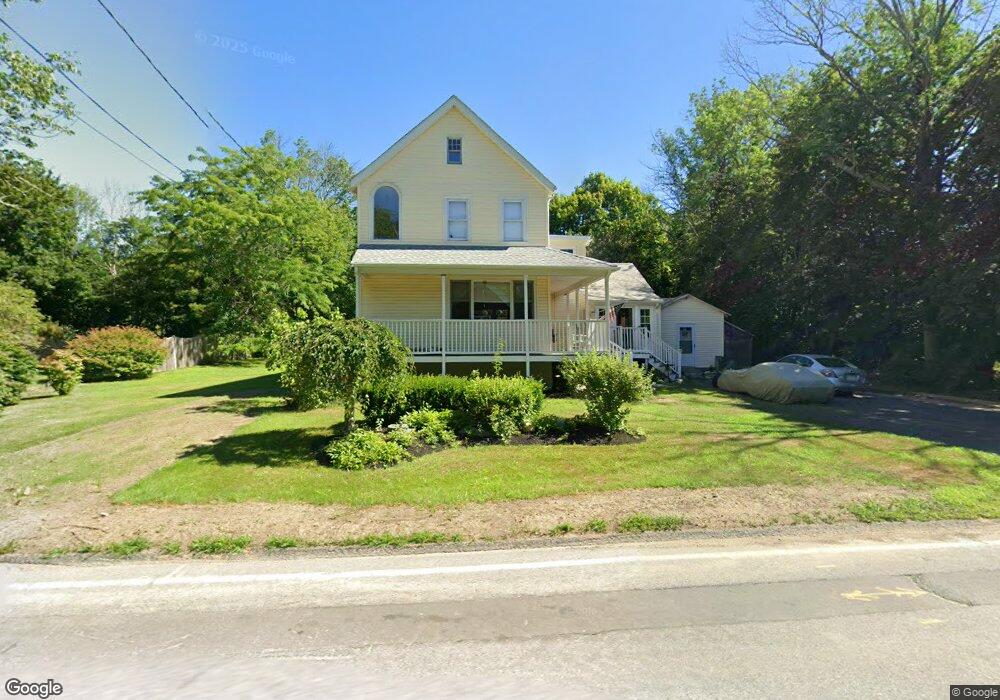
About This Home
This home is located at 398 High St, Pembroke, MA 02359 and is currently estimated at $578,353, approximately $324 per square foot. 398 High St is a home located in Plymouth County with nearby schools including Pembroke High School.
Ownership History
We collect this data history from publicly available records. To have your information removed, we recommend requesting removal directly through your county’s website.
Purchase Details
Purchase History
We collect this data history from publicly available records. To have your information removed, we recommend requesting removal directly through your county’s website.
| Date | Buyer | Sale Price | Title Company |
|---|---|---|---|
| $90,000 | -- |
Mortgage History
We collect this data history from publicly available records. To have your information removed, we recommend requesting removal directly through your county’s website.
| Date | Status | Borrower | Loan Amount |
|---|---|---|---|
| Open | $215,000 | ||
| Closed | $50,000 | ||
| Closed | $50,000 | ||
| Closed | $15,000 | ||
| Closed | $199,000 | ||
| Closed | $193,000 | ||
| Closed | $154,000 |
Tax History
We collect this data history from publicly available records. To have your information removed, we recommend requesting removal directly through your county’s website.
| Year | Tax Paid | Tax Assessment Tax Assessment Total Assessment is a certain percentage of the fair market value that is determined by local assessors to be the total taxable value of land and additions on the property. | Land | Improvement |
|---|---|---|---|---|
| 2025 | $5,837 | $485,600 | $285,300 | $200,300 |
| 2024 | $5,576 | $463,500 | $267,500 | $196,000 |
| 2023 | $5,574 | $438,200 | $254,300 | $183,900 |
| 2022 | $5,268 | $372,300 | $209,700 | $162,600 |
| 2021 | $4,916 | $337,200 | $196,100 | $141,100 |
| 2020 | $5,166 | $356,500 | $191,900 | $164,600 |
| 2019 | $5,078 | $347,800 | $187,200 | $160,600 |
| 2018 | $4,862 | $326,500 | $182,700 | $143,800 |
| 2017 | $4,803 | $318,100 | $174,000 | $144,100 |
| 2016 | $4,657 | $305,200 | $161,100 | $144,100 |
| 2015 | $4,370 | $296,500 | $152,400 | $144,100 |
Map
- 411 High St
- 374 High St
- 354 High St
- 21 Forest St
- 249 High St
- 801 Washington St Unit 8
- 715 Washington St
- 190 Mountain Ave
- 17 Kiley Way
- 133 Mountain Ave
- 26 Pierce Dr
- 136 Taylor St
- 590 Washington St Unit 7
- 547 Washington St Unit C10
- 459 Union Bridge Rd
- 600 Summer St Unit 17
- 109 Birch St
- 45 Taylor St
- 197 Birch St
- 430 Lake Shore Dr
Ask me questions while you tour the home.