3992 N 300 W Cayuga, IN 47928
Estimated Value: $152,000 - $338,087
3
Beds
2
Baths
1,316
Sq Ft
$175/Sq Ft
Est. Value
About This Home
This home is located at 3992 N 300 W, Cayuga, IN 47928 and is currently estimated at $230,029, approximately $174 per square foot. 3992 N 300 W is a home located in Vermillion County with nearby schools including North Vermillion Elementary School and North Vermillion High School.
Ownership History
Date
Name
Owned For
Owner Type
Purchase Details
Closed on
Apr 16, 2023
Sold by
Morgan Darrell W
Bought by
Two-Twelve Llc
Current Estimated Value
Purchase Details
Closed on
Jul 27, 2022
Sold by
Morgan Earl O and Morgan Eileen E
Bought by
Morgan Darrell W
Create a Home Valuation Report for This Property
The Home Valuation Report is an in-depth analysis detailing your home's value as well as a comparison with similar homes in the area
Purchase History
| Date | Buyer | Sale Price | Title Company |
|---|---|---|---|
| Two-Twelve Llc | -- | None Listed On Document | |
| Morgan Darrell W | -- | -- |
Source: Public Records
Tax History
| Year | Tax Paid | Tax Assessment Tax Assessment Total Assessment is a certain percentage of the fair market value that is determined by local assessors to be the total taxable value of land and additions on the property. | Land | Improvement |
|---|---|---|---|---|
| 2025 | $3,176 | $174,300 | $85,100 | $89,200 |
| 2024 | $3,176 | $178,100 | $90,200 | $87,900 |
| 2023 | $2,973 | $154,800 | $76,000 | $78,800 |
| 2022 | $1,649 | $144,600 | $62,800 | $81,800 |
| 2021 | $1,412 | $123,500 | $56,200 | $67,300 |
| 2020 | $1,327 | $114,900 | $53,800 | $61,100 |
| 2019 | $1,556 | $129,500 | $61,600 | $67,900 |
| 2018 | $1,527 | $131,100 | $63,200 | $67,900 |
| 2017 | $1,638 | $140,400 | $70,900 | $69,500 |
| 2016 | $1,620 | $142,800 | $74,400 | $68,400 |
| 2014 | $1,455 | $140,400 | $77,300 | $63,100 |
| 2013 | $1,455 | $128,100 | $68,000 | $60,100 |
Source: Public Records
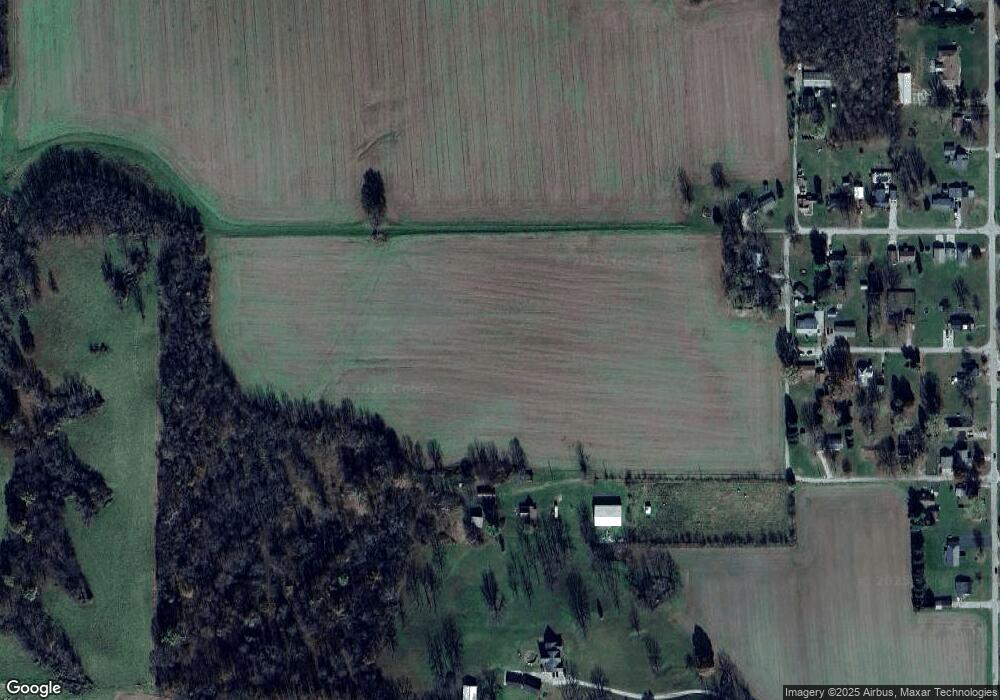
Map
Nearby Homes
- Fox Tail Ln
- 612 Arrasmith Ave
- 404 S 8th St
- 908 S Division St
- 7200 State Line Rd
- 7138 N State Line Rd
- 219 N Wabash St
- 2371 N 1860 East Rd
- Lot 14 Mcclain Ave
- 7796 N Meridian Rd
- 0 N 100 St W Unit 108460
- 22715 E 2650th Rd
- 0 State Road 234
- 607 S Walnut St
- 217 E Oak St
- 643 S Main St
- 1 1000 N
- 208 E 7th St Unit H
- 1500 College Ave
- 213 Vermilion St
- 3966 N 300 W
- 3827 N 300 W
- 3900 N 300 W
- 2869 W State Road 234
- 2869 Indiana 234
- 3071 W State Road 234
- 3742 N 300 W
- 3735 N 300 W
- 2752 W State Road 234
- 2752 W State Road 234
- 2673 Indiana 234
- 2556 W State Road 234
- 2556 Indiana 234
- 3388 W State Road 234
- 3388 Indiana 234
- 3397 W State Road 234
- 2415 W State Road 234
- 3479 W State Road 234
- 23961 Mill Rd
- 0 Unit 202500274
Your Personal Tour Guide
Ask me questions while you tour the home.