4 9th Ave Wareham, MA 02571
Weweantic NeighborhoodEstimated Value: $280,000 - $396,000
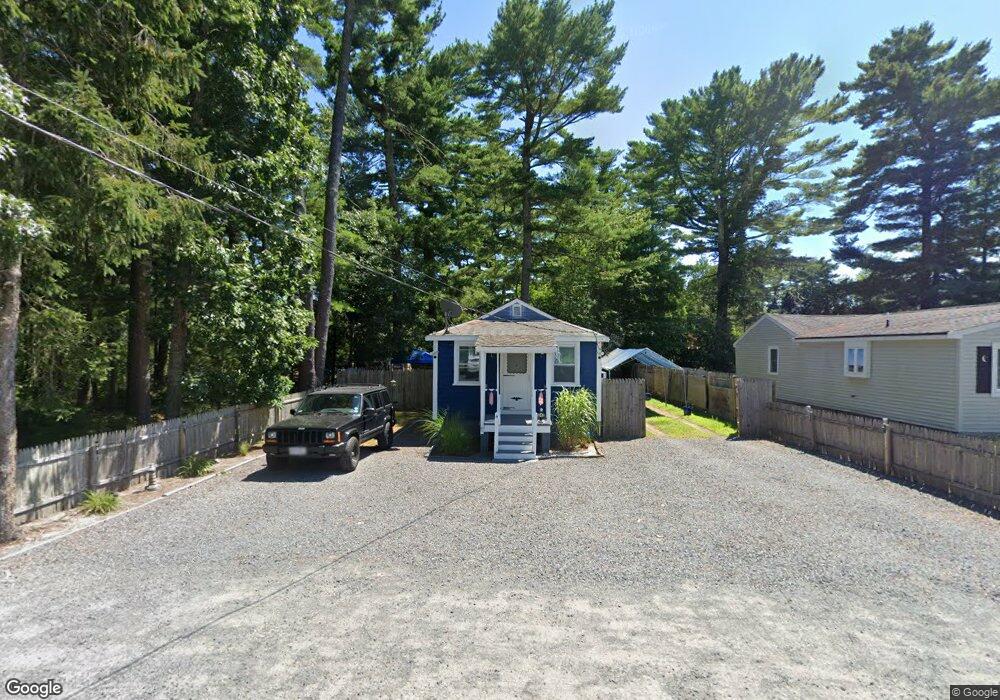
About This Home
This home is located at 4 9th Ave, Wareham, MA 02571 and is currently estimated at $321,644, approximately $628 per square foot. 4 9th Ave is a home located in Plymouth County with nearby schools including Tabor Academy.
Ownership History
We collect this data history from publicly available records. To have your information removed, we recommend requesting removal directly through your county’s website.
Purchase Details
Home Financials for this Owner
Home Financials are based on the most recent Mortgage that was taken out on this home.Home Values in the Area
Average Home Value in this Area
Purchase History
We collect this data history from publicly available records. To have your information removed, we recommend requesting removal directly through your county’s website.
| Date | Buyer | Sale Price | Title Company |
|---|---|---|---|
| $130,000 | -- | ||
| $130,000 | -- |
Mortgage History
We collect this data history from publicly available records. To have your information removed, we recommend requesting removal directly through your county’s website.
| Date | Status | Borrower | Loan Amount |
|---|---|---|---|
| Open | $126,890 | ||
| Closed | $10,000 | ||
| Closed | $126,890 | ||
| Previous Owner | $83,800 |
Tax History
We collect this data history from publicly available records. To have your information removed, we recommend requesting removal directly through your county’s website.
| Year | Tax Paid | Tax Assessment Tax Assessment Total Assessment is a certain percentage of the fair market value that is determined by local assessors to be the total taxable value of land and additions on the property. | Land | Improvement |
|---|---|---|---|---|
| 2025 | $2,481 | $238,100 | $104,800 | $133,300 |
| 2024 | $2,541 | $226,300 | $80,300 | $146,000 |
| 2023 | $2,424 | $201,500 | $73,000 | $128,500 |
| 2022 | $2,252 | $170,900 | $73,000 | $97,900 |
| 2021 | $2,114 | $157,200 | $73,000 | $84,200 |
| 2020 | $2,014 | $151,900 | $73,000 | $78,900 |
| 2019 | $1,822 | $137,100 | $66,000 | $71,100 |
| 2018 | $1,697 | $124,500 | $66,000 | $58,500 |
| 2017 | $1,306 | $97,100 | $66,000 | $31,100 |
| 2016 | $1,208 | $89,300 | $62,500 | $26,800 |
| 2015 | $1,167 | $89,300 | $62,500 | $26,800 |
| 2014 | $1,110 | $86,400 | $59,400 | $27,000 |
Map
- 27 Highland Shores Dr
- 88 Hathaway St
- 10 3rd Ave
- 7 Highland Bay Dr
- 26 1st Ave
- 347 Marion Rd
- 21 Bisbee St
- 9 Rock Marsh Rd Unit B
- 9 Rock Marsh Rd Unit B
- 22 Fairfield Dr
- 233 Marion Rd
- 12 Taft St
- 64 Rosepoint Ave
- 37 Lincoln Hwy
- 26 Washington Dr
- 21 River Rd
- 11 + 13 Blackmore Pond Cir
- 11 Mya's Ct
- 21 Dinahs Way
- 189 Blackmore Pond Rd
Ask me questions while you tour the home.