4 Anchorage Ln Marblehead, MA 01945
Marblehead AreaEstimated Value: $4,019,000 - $5,489,145
About This Home
This home is located at 4 Anchorage Ln, Marblehead, MA 01945 and is currently estimated at $4,879,715, approximately $1,043 per square foot. 4 Anchorage Ln is a home located in Essex County with nearby schools including Marblehead High School, Marblehead Community Charter Public School, and Tower School.
Ownership History
We collect this data history from publicly available records. To have your information removed, we recommend requesting removal directly through your county’s website.
Purchase Details
Purchase Details
Purchase Details
Purchase Details
Home Financials for this Owner
Home Financials are based on the most recent Mortgage that was taken out on this home.Purchase Details
Home Values in the Area
Average Home Value in this Area
Purchase History
We collect this data history from publicly available records. To have your information removed, we recommend requesting removal directly through your county’s website.
| Date | Buyer | Sale Price | Title Company |
|---|---|---|---|
| -- | -- | ||
| $5,300,000 | -- | ||
| $410,000 | -- | ||
| -- | -- | ||
| $1,200,000 | -- |
Mortgage History
We collect this data history from publicly available records. To have your information removed, we recommend requesting removal directly through your county’s website.
| Date | Status | Borrower | Loan Amount |
|---|---|---|---|
| Previous Owner | $3,000,000 | ||
| Previous Owner | $500,000 | ||
| Previous Owner | $500,000 | ||
| Previous Owner | $2,600,000 | ||
| Previous Owner | $200,000 | ||
| Previous Owner | $1,500,000 | ||
| Previous Owner | $500,000 | ||
| Previous Owner | $100,000 |
Tax History
We collect this data history from publicly available records. To have your information removed, we recommend requesting removal directly through your county’s website.
| Year | Tax Paid | Tax Assessment Tax Assessment Total Assessment is a certain percentage of the fair market value that is determined by local assessors to be the total taxable value of land and additions on the property. | Land | Improvement |
|---|---|---|---|---|
| 2025 | $66,955 | $7,398,300 | $4,323,100 | $3,075,200 |
| 2024 | $68,914 | $7,691,300 | $4,367,100 | $3,324,200 |
| 2023 | $62,951 | $6,295,100 | $3,663,100 | $2,632,000 |
| 2022 | $63,242 | $6,011,600 | $3,443,100 | $2,568,500 |
| 2021 | $61,054 | $5,859,300 | $3,333,100 | $2,526,200 |
| 2020 | $60,295 | $5,803,200 | $3,333,100 | $2,470,100 |
| 2019 | $60,246 | $5,609,500 | $3,245,100 | $2,364,400 |
| 2018 | $61,574 | $5,587,500 | $3,223,100 | $2,364,400 |
| 2017 | $61,518 | $5,587,500 | $3,223,100 | $2,364,400 |
| 2016 | $61,282 | $5,520,900 | $3,157,100 | $2,363,800 |
| 2015 | $56,901 | $5,135,500 | $3,003,100 | $2,132,400 |
| 2014 | $57,893 | $5,220,300 | $3,223,100 | $1,997,200 |
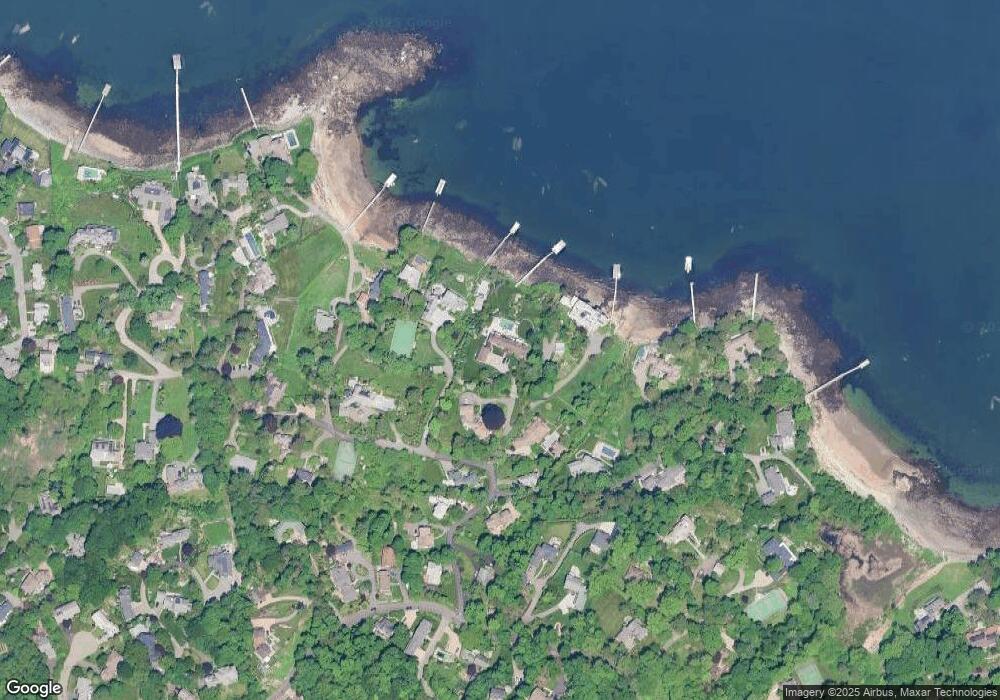
Map
- 23 Whittier Rd
- 17 Crowninshield Rd
- 20 Crowninshield Rd
- 12 Johns Rd
- 1 Johns Rd
- 155 Green St Unit 4
- 6 Calthrope 2 Togan Way
- 10 Naugus Ave
- 24 Pond St Unit 1
- 16 Liberty Rd
- 8 Franklin St Unit 19
- 7 Fort Beach Way
- 3 Frost Ln
- 33 Franklin St
- 20 Mechanic Square Unit 2
- 20 Mechanic Square Unit 3
- 31 Mugford St
- 137 Front St
- 121 Elm St Unit 2
- 29 & 31 Circle St
Ask me questions while you tour the home.