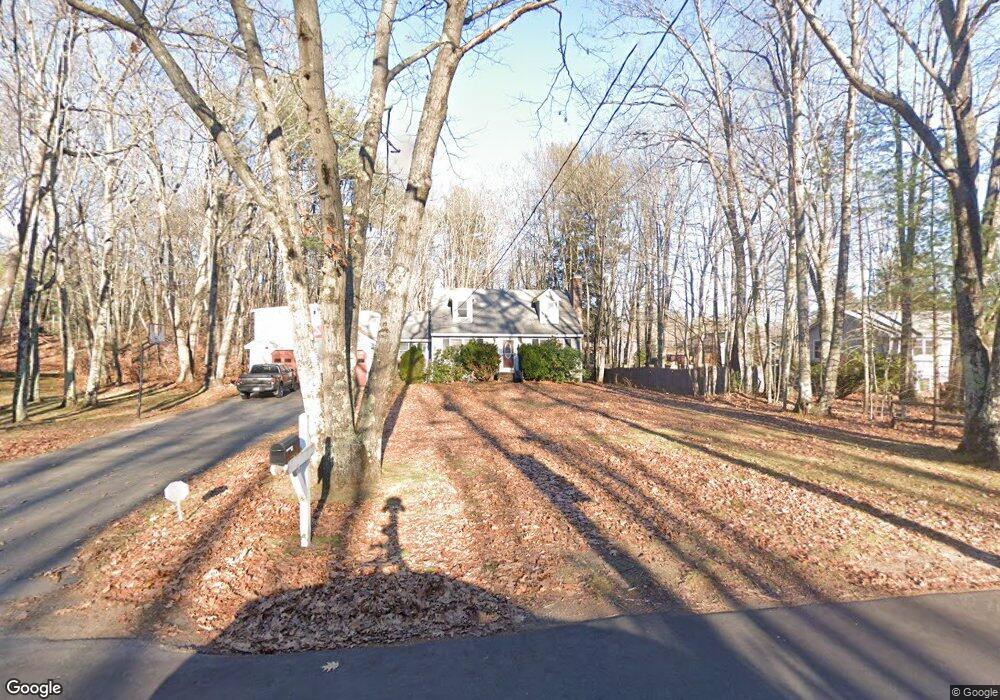
4 Arbor Ave Topsham, ME 04086
Estimated Value: $488,000 - $527,000
4
Beds
2
Baths
1,988
Sq Ft
$256/Sq Ft
Est. Value
About This Home
This home is located at 4 Arbor Ave, Topsham, ME 04086 and is currently estimated at $509,605, approximately $256 per square foot. 4 Arbor Ave is a home located in Sagadahoc County with nearby schools including Mt Ararat High School, Harpswell Coastal Academy Divisions 2 and 3, and St John's Catholic School.
Ownership History
Date
Name
Owned For
Owner Type
Purchase Details
Closed on
Nov 2, 2010
Sold by
Francine Pierre S
Bought by
Dube James P and Dube Shana M
Current Estimated Value
Home Financials for this Owner
Home Financials are based on the most recent Mortgage that was taken out on this home.
Original Mortgage
$152,100
Outstanding Balance
$100,181
Interest Rate
4.39%
Mortgage Type
Unknown
Estimated Equity
$409,424
Create a Home Valuation Report for This Property
The Home Valuation Report is an in-depth analysis detailing your home's value as well as a comparison with similar homes in the area
Home Values in the Area
Average Home Value in this Area
Purchase History
| Date | Buyer | Sale Price | Title Company |
|---|---|---|---|
| Dube James P | -- | -- |
Source: Public Records
Mortgage History
| Date | Status | Borrower | Loan Amount |
|---|---|---|---|
| Open | Dube James P | $152,100 |
Source: Public Records
Tax History
| Year | Tax Paid | Tax Assessment Tax Assessment Total Assessment is a certain percentage of the fair market value that is determined by local assessors to be the total taxable value of land and additions on the property. | Land | Improvement |
|---|---|---|---|---|
| 2025 | $5,984 | $467,500 | $76,100 | $391,400 |
| 2024 | $5,863 | $469,000 | $70,400 | $398,600 |
| 2023 | $5,613 | $413,300 | $67,100 | $346,200 |
| 2022 | $4,883 | $338,600 | $64,800 | $273,800 |
| 2021 | $4,750 | $299,300 | $59,500 | $239,800 |
| 2020 | $4,797 | $268,600 | $59,500 | $209,100 |
| 2019 | $4,625 | $241,500 | $59,500 | $182,000 |
| 2018 | $4,314 | $230,300 | $48,700 | $181,600 |
| 2017 | $4,173 | $230,300 | $48,700 | $181,600 |
| 2016 | $4,075 | $226,500 | $48,700 | $177,800 |
| 2015 | $3,931 | $218,900 | $48,700 | $170,200 |
| 2014 | $3,662 | $211,300 | $48,700 | $162,600 |
| 2013 | $3,518 | $211,300 | $48,700 | $162,600 |
Source: Public Records
Map
Nearby Homes
Your Personal Tour Guide
Ask me questions while you tour the home.