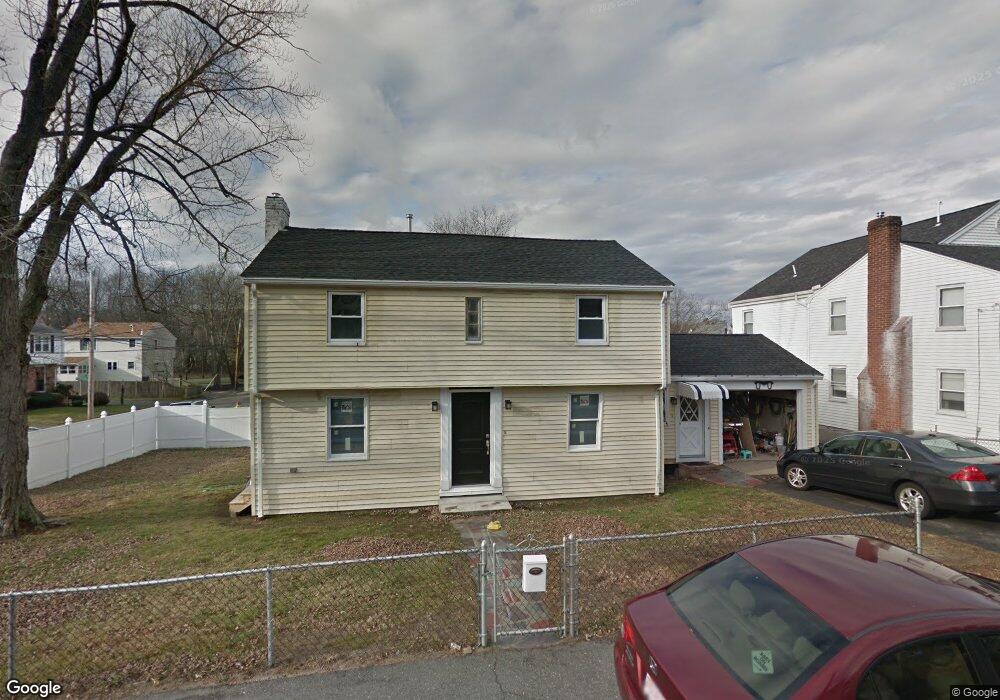
4 Barry St Quincy, MA 02169
South Quincy NeighborhoodEstimated Value: $643,000 - $710,000
3
Beds
1
Bath
1,358
Sq Ft
$498/Sq Ft
Est. Value
About This Home
This home is located at 4 Barry St, Quincy, MA 02169 and is currently estimated at $675,874, approximately $497 per square foot. 4 Barry St is a home located in Norfolk County with nearby schools including South West Middle School, Lincoln-Hancock Community School, and Quincy High School.
Ownership History
Date
Name
Owned For
Owner Type
Purchase Details
Closed on
Feb 23, 2007
Sold by
Cluett Janet and Cluett Robert
Bought by
Nguyen Max
Current Estimated Value
Home Financials for this Owner
Home Financials are based on the most recent Mortgage that was taken out on this home.
Original Mortgage
$268,000
Outstanding Balance
$161,144
Interest Rate
6.23%
Mortgage Type
Purchase Money Mortgage
Estimated Equity
$514,730
Create a Home Valuation Report for This Property
The Home Valuation Report is an in-depth analysis detailing your home's value as well as a comparison with similar homes in the area
Home Values in the Area
Average Home Value in this Area
Purchase History
| Date | Buyer | Sale Price | Title Company |
|---|---|---|---|
| Nguyen Max | $335,000 | -- |
Source: Public Records
Mortgage History
| Date | Status | Borrower | Loan Amount |
|---|---|---|---|
| Open | Nguyen Max | $268,000 | |
| Closed | Nguyen Max | $67,000 |
Source: Public Records
Tax History
| Year | Tax Paid | Tax Assessment Tax Assessment Total Assessment is a certain percentage of the fair market value that is determined by local assessors to be the total taxable value of land and additions on the property. | Land | Improvement |
|---|---|---|---|---|
| 2025 | $6,730 | $583,700 | $268,100 | $315,600 |
| 2024 | $6,364 | $564,700 | $255,300 | $309,400 |
| 2023 | $5,911 | $531,100 | $243,200 | $287,900 |
| 2022 | $5,517 | $460,500 | $194,500 | $266,000 |
| 2021 | $5,474 | $450,900 | $194,500 | $256,400 |
| 2020 | $5,218 | $419,800 | $194,500 | $225,300 |
| 2019 | $5,063 | $403,400 | $188,800 | $214,600 |
| 2018 | $4,981 | $373,400 | $174,900 | $198,500 |
| 2017 | $4,908 | $346,400 | $166,500 | $179,900 |
| 2016 | $4,595 | $320,000 | $151,400 | $168,600 |
| 2015 | $4,435 | $303,800 | $142,800 | $161,000 |
| 2014 | $4,323 | $290,900 | $142,800 | $148,100 |
Source: Public Records
Map
Nearby Homes
- 39 Cross St
- 40 Cross St Unit 1
- 211 Copeland St
- 230 Willard St Unit 102
- 230 Willard St Unit 207
- 149 Reservoir Rd
- 84 West St Unit 1
- 580 Quarry St Unit 13
- 21 Arthur St
- 510 Willard St
- 9 Westford St
- 91 Garfield St
- 156 West St
- 132 Centre St
- 165 Whitwell St
- 211 West St Unit 11B
- 211 West St Unit 12B
- 41 Wallace Rd
- 52 Packards Ln Unit 4
- 475 Beale St
Your Personal Tour Guide
Ask me questions while you tour the home.