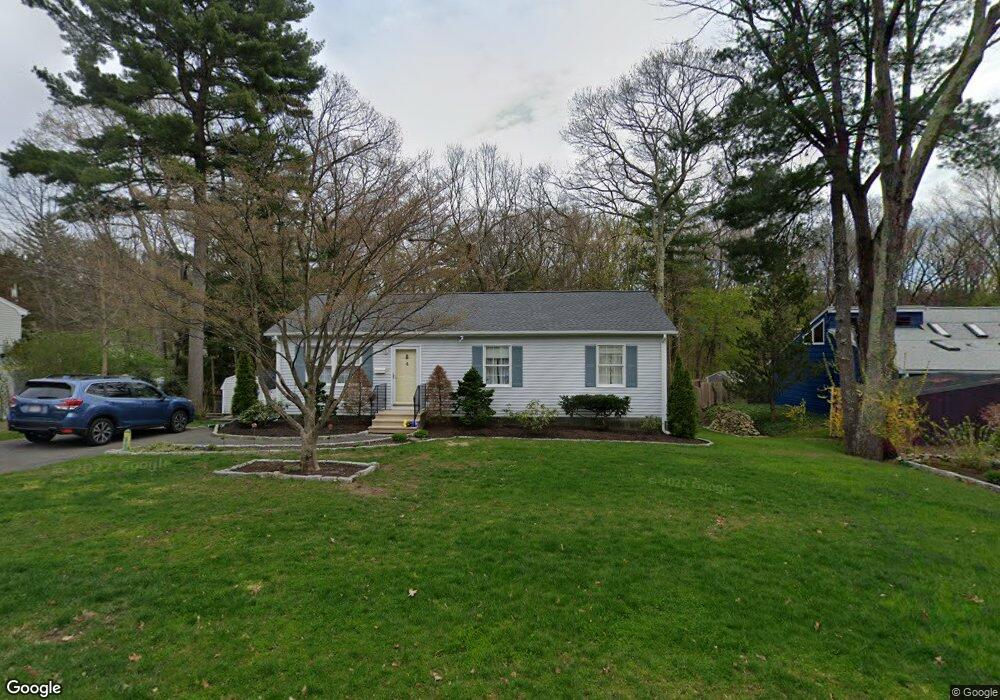
4 Burbank Cir Framingham, MA 01701
Nobscot NeighborhoodEstimated Value: $546,000 - $675,654
About This Home
This home is located at 4 Burbank Cir, Framingham, MA 01701 and is currently estimated at $618,664, approximately $540 per square foot. 4 Burbank Cir is a home located in Middlesex County with nearby schools including Framingham High School, MetroWest Jewish Day School, and Sudbury Valley School.
Ownership History
We collect this data history from publicly available records. To have your information removed, we recommend requesting removal directly through your county’s website.
Purchase Details
Purchase Details
Home Financials for this Owner
Home Financials are based on the most recent Mortgage that was taken out on this home.Home Values in the Area
Average Home Value in this Area
Purchase History
We collect this data history from publicly available records. To have your information removed, we recommend requesting removal directly through your county’s website.
| Date | Buyer | Sale Price | Title Company |
|---|---|---|---|
| -- | None Available | ||
| -- | None Available | ||
| $164,000 | -- | ||
| $164,000 | -- |
Mortgage History
We collect this data history from publicly available records. To have your information removed, we recommend requesting removal directly through your county’s website.
| Date | Status | Borrower | Loan Amount |
|---|---|---|---|
| Previous Owner | $154,000 | ||
| Previous Owner | $131,200 |
Tax History
We collect this data history from publicly available records. To have your information removed, we recommend requesting removal directly through your county’s website.
| Year | Tax Paid | Tax Assessment Tax Assessment Total Assessment is a certain percentage of the fair market value that is determined by local assessors to be the total taxable value of land and additions on the property. | Land | Improvement |
|---|---|---|---|---|
| 2025 | $7,655 | $641,100 | $265,200 | $375,900 |
| 2024 | $7,474 | $599,800 | $236,800 | $363,000 |
| 2023 | $6,880 | $525,600 | $211,300 | $314,300 |
| 2022 | $6,521 | $474,600 | $191,800 | $282,800 |
| 2021 | $6,367 | $453,200 | $184,300 | $268,900 |
| 2020 | $6,356 | $424,300 | $167,500 | $256,800 |
| 2019 | $6,250 | $406,400 | $167,500 | $238,900 |
| 2018 | $7,029 | $430,700 | $161,300 | $269,400 |
| 2017 | $6,754 | $404,200 | $156,600 | $247,600 |
| 2016 | $6,530 | $375,700 | $156,600 | $219,100 |
| 2015 | $6,062 | $340,200 | $156,800 | $183,400 |
Map
- 51 Hadley Rd
- 62 Hemenway Rd
- 2 Hemenway Rd
- 19 Swanson Rd
- 915 Edgell Rd Unit 61
- 4 Edith Rd
- 7 Edith Rd
- 2005 Windsor Dr Unit 2005
- 6 Oakwood Ct
- 1207 Windsor Dr
- 17 Clara Rd
- 2 Whiting Rd
- 1239 Edgell Rd
- 36 Simpson Dr
- 20 Temi Rd
- 70 Harrington Rd
- 83 Nicholas Rd Unit D
- 81 Nicholas Rd Unit H
- 18 Griffin Rd
- 79 Nicholas Rd Unit H
Ask me questions while you tour the home.