4 Celtic Ct Uxbridge, MA 01569
Uxbridge AreaEstimated Value: $630,000 - $775,000
About This Home
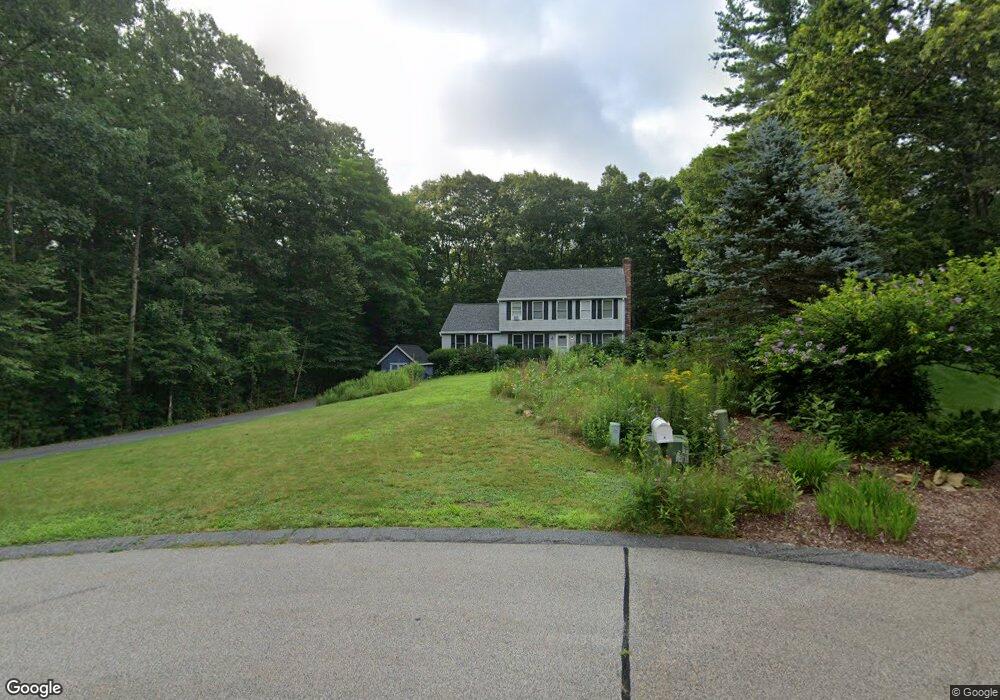
This home is located at 4 Celtic Ct, Uxbridge, MA 01569 and is currently estimated at $678,901, approximately $342 per square foot. 4 Celtic Ct is a home located in Worcester County with nearby schools including Uxbridge High School and Our Lady of the Valley Regional School.
Ownership History
We collect this data history from publicly available records. To have your information removed, we recommend requesting removal directly through your county’s website.
Purchase Details
Home Values in the Area
Average Home Value in this Area
Purchase History
We collect this data history from publicly available records. To have your information removed, we recommend requesting removal directly through your county’s website.
| Date | Buyer | Sale Price | Title Company |
|---|---|---|---|
| $199,900 | -- |
Mortgage History
We collect this data history from publicly available records. To have your information removed, we recommend requesting removal directly through your county’s website.
| Date | Status | Borrower | Loan Amount |
|---|---|---|---|
| Open | $308,800 | ||
| Closed | $196,000 | ||
| Closed | $250,750 | ||
| Closed | $182,950 |
Tax History
We collect this data history from publicly available records. To have your information removed, we recommend requesting removal directly through your county’s website.
| Year | Tax Paid | Tax Assessment Tax Assessment Total Assessment is a certain percentage of the fair market value that is determined by local assessors to be the total taxable value of land and additions on the property. | Land | Improvement |
|---|---|---|---|---|
| 2025 | $7,112 | $542,500 | $172,100 | $370,400 |
| 2024 | $6,738 | $521,500 | $163,400 | $358,100 |
| 2023 | $6,379 | $457,300 | $141,100 | $316,200 |
| 2022 | $5,755 | $379,600 | $123,700 | $255,900 |
| 2021 | $5,964 | $377,000 | $121,100 | $255,900 |
| 2020 | $6,080 | $363,200 | $119,300 | $243,900 |
| 2019 | $6,034 | $347,800 | $119,300 | $228,500 |
| 2018 | $5,864 | $341,500 | $119,300 | $222,200 |
| 2017 | $5,319 | $313,600 | $109,600 | $204,000 |
| 2016 | $5,510 | $313,600 | $104,300 | $209,300 |
| 2015 | $5,382 | $309,300 | $104,300 | $205,000 |
Map
- 53 Arnold Way
- 5 White Ct
- 203 Maple St
- 277 Yew St
- 145 Turner Farm Rd
- 13 Perry St
- Lot 43 Turner Farm Rd
- 20 Turner Farm Rd
- 359 SE Main St
- 7 Lamire Way
- 307 S East Main St Unit Lot 9
- 299 S East Main St Unit Lot 8
- 2 Isabella Dr
- 235 Yew St
- 87 Martin Rd
- 6 Chamberlain Rd
- 56 King St
- 78 Franklin St
- 208 Crownshield Ave Unit 208
- 126 Yew St
Ask me questions while you tour the home.