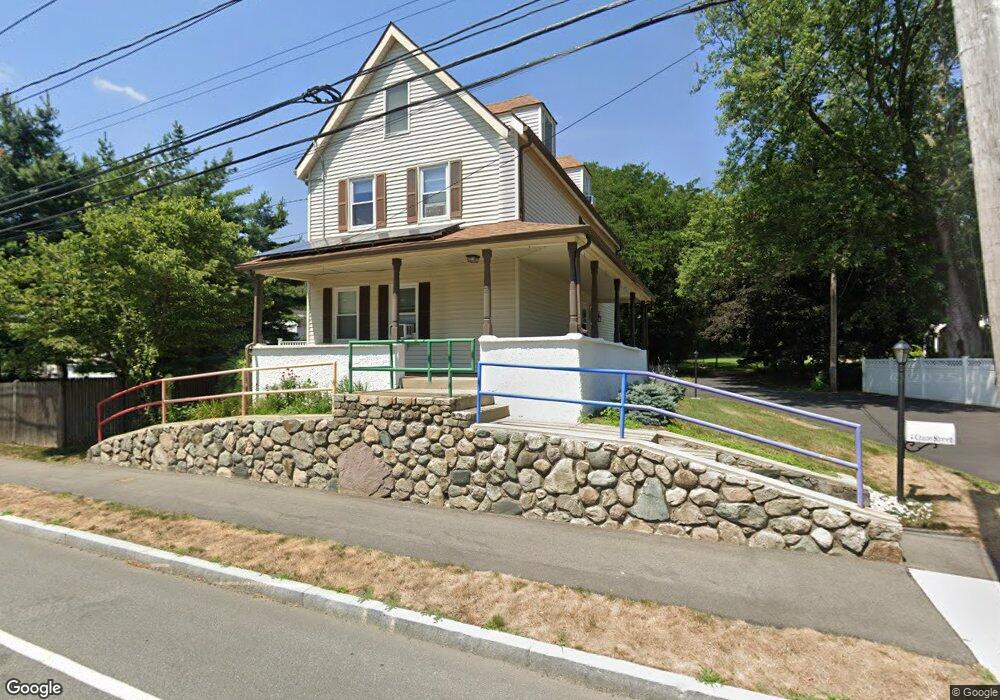
4 Crane St Needham Heights, MA 02494
Estimated Value: $1,294,349 - $1,689,000
3
Beds
4
Baths
983
Sq Ft
$1,467/Sq Ft
Est. Value
About This Home
This home is located at 4 Crane St, Needham Heights, MA 02494 and is currently estimated at $1,442,087, approximately $1,467 per square foot. 4 Crane St is a home located in Norfolk County with nearby schools including Eliot Elementary School, High Rock Middle School, and Pollard Middle School.
Ownership History
Date
Name
Owned For
Owner Type
Purchase Details
Closed on
Oct 30, 2000
Sold by
Moore Robert J and Moore Nancy A
Bought by
Lees Mathew D and Lees Susan K
Current Estimated Value
Home Financials for this Owner
Home Financials are based on the most recent Mortgage that was taken out on this home.
Original Mortgage
$345,600
Interest Rate
7.83%
Mortgage Type
Purchase Money Mortgage
Create a Home Valuation Report for This Property
The Home Valuation Report is an in-depth analysis detailing your home's value as well as a comparison with similar homes in the area
Home Values in the Area
Average Home Value in this Area
Purchase History
We collect this data history from publicly available records. To have your information removed, we recommend requesting removal directly through your county’s website.
| Date | Buyer | Sale Price | Title Company |
|---|---|---|---|
| Lees Mathew D | $432,000 | -- |
Source: Public Records
Mortgage History
We collect this data history from publicly available records. To have your information removed, we recommend requesting removal directly through your county’s website.
| Date | Status | Borrower | Loan Amount |
|---|---|---|---|
| Open | Lees Mathew D | $395,000 | |
| Closed | Lees Mathew D | $345,600 | |
| Previous Owner | Lees Mathew D | $201,500 |
Source: Public Records
Tax History
| Year | Tax Paid | Tax Assessment Tax Assessment Total Assessment is a certain percentage of the fair market value that is determined by local assessors to be the total taxable value of land and additions on the property. | Land | Improvement |
|---|---|---|---|---|
| 2025 | $12,802 | $1,207,700 | $755,300 | $452,400 |
| 2024 | $11,938 | $953,500 | $487,900 | $465,600 |
| 2023 | $12,057 | $924,600 | $487,900 | $436,700 |
| 2022 | $11,504 | $860,400 | $436,400 | $424,000 |
| 2021 | $11,211 | $860,400 | $436,400 | $424,000 |
| 2020 | $10,458 | $837,300 | $436,400 | $400,900 |
| 2019 | $9,804 | $791,300 | $397,400 | $393,900 |
| 2018 | $9,401 | $791,300 | $397,400 | $393,900 |
| 2017 | $7,743 | $651,200 | $397,400 | $253,800 |
| 2016 | $7,515 | $651,200 | $397,400 | $253,800 |
| 2015 | $7,352 | $651,200 | $397,400 | $253,800 |
| 2014 | $6,709 | $576,400 | $332,400 | $244,000 |
Source: Public Records
Map
Nearby Homes
- 48 Taylor St
- 75 Wellesley Ave
- 30 Webster St Unit 3
- 12 Hill St
- 48 Gary Rd
- 11 Greenough St
- 4 Park River St
- 8 Noanett Rd
- 102 Booth St
- 23 Yale Rd
- 279 Oakland St
- 72 Putnam St
- 140 Hillside Ave
- 140 Hillside Ave Unit a
- 134 Hillside Ave Unit 134
- 785 Highland Ave
- 56 Crescent Rd
- 56 Crescent Rd Unit 56
- 20 Crescent Rd Unit 20
- 100 Woodbine Cir
- 369 Central Ave
- 387 Central Ave
- 378 Central Ave
- 11 Crane St
- 370 Central Ave
- 386 Central Ave
- 361 Central Ave
- 360 Central Ave
- 398 Central Ave
- 357 Central Ave
- 20 Jennifer Cir
- 393 Central Ave
- 393 Central Ave Unit 1
- 393 Central Ave Unit 1,393
- 403 Central Ave
- 11 Jennifer Cir
- 351 Central Ave
- 7 John St
- 11 John St
- 26 Jennifer Cir
Your Personal Tour Guide
Ask me questions while you tour the home.