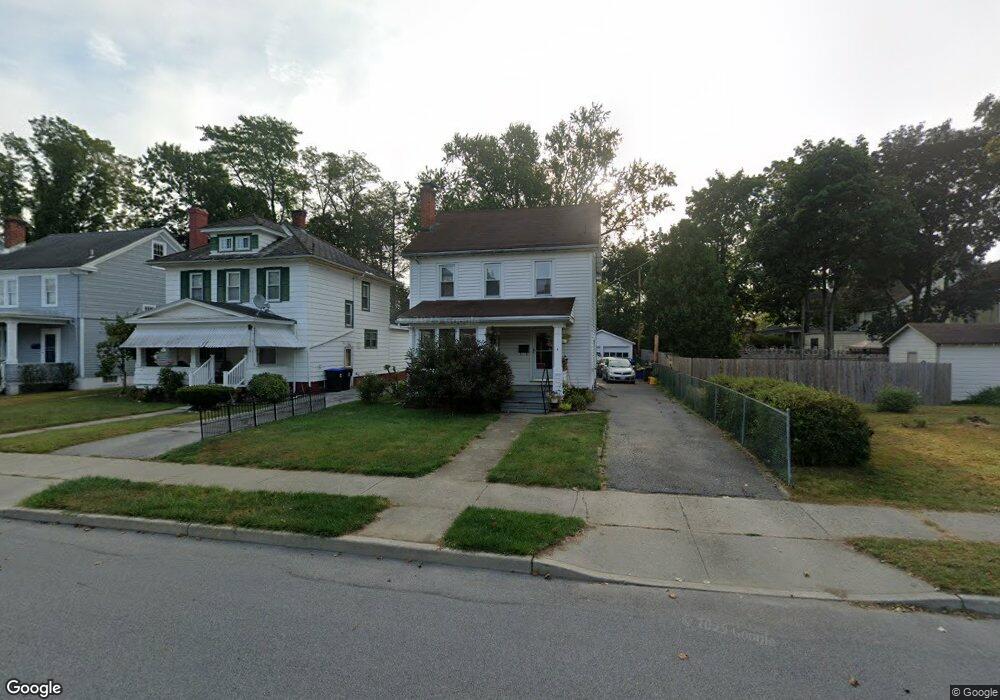
4 Daniels Ct Poughkeepsie, NY 12603
Estimated Value: $266,000 - $379,332
3
Beds
2
Baths
1,344
Sq Ft
$257/Sq Ft
Est. Value
About This Home
This home is located at 4 Daniels Ct, Poughkeepsie, NY 12603 and is currently estimated at $345,333, approximately $256 per square foot. 4 Daniels Ct is a home located in Dutchess County with nearby schools including Poughkeepsie High School, Holy Trinity School, and Tabernacle Christian Academy.
Ownership History
Date
Name
Owned For
Owner Type
Purchase Details
Closed on
Aug 7, 2018
Sold by
Dennis P Kehoe
Bought by
Basora Richard
Current Estimated Value
Home Financials for this Owner
Home Financials are based on the most recent Mortgage that was taken out on this home.
Original Mortgage
$209,622
Outstanding Balance
$182,446
Interest Rate
4.6%
Estimated Equity
$162,887
Purchase Details
Closed on
Feb 3, 2006
Sold by
Detmer Estate Anna
Bought by
Marone Corrado
Home Financials for this Owner
Home Financials are based on the most recent Mortgage that was taken out on this home.
Original Mortgage
$150,000
Interest Rate
6.31%
Mortgage Type
Purchase Money Mortgage
Create a Home Valuation Report for This Property
The Home Valuation Report is an in-depth analysis detailing your home's value as well as a comparison with similar homes in the area
Home Values in the Area
Average Home Value in this Area
Purchase History
| Date | Buyer | Sale Price | Title Company |
|---|---|---|---|
| Basora Richard | -- | -- | |
| Marone Corrado | $150,000 | -- |
Source: Public Records
Mortgage History
| Date | Status | Borrower | Loan Amount |
|---|---|---|---|
| Open | Basora Richard | $209,622 | |
| Closed | Basora Richard | -- | |
| Previous Owner | Marone Corrado | $150,000 |
Source: Public Records
Tax History
| Year | Tax Paid | Tax Assessment Tax Assessment Total Assessment is a certain percentage of the fair market value that is determined by local assessors to be the total taxable value of land and additions on the property. | Land | Improvement |
|---|---|---|---|---|
| 2024 | $9,019 | $300,700 | $59,400 | $241,300 |
| 2023 | $11,988 | $289,100 | $59,400 | $229,700 |
| 2019 | $6,102 | $158,700 | $54,000 | $104,700 |
Source: Public Records
Map
Nearby Homes
- 44 Glenwood Ave
- 42 Manitou Ave
- 46 Fountain Place
- 16 Beechwood Terrace
- 9 Edgar St
- 7 Gray St
- 11 Manitou Ave
- 122 S Cherry St
- 171 Hooker Ave
- 113 Hooker Ave
- 105 Hooker Ave
- 409 Baker St
- 7 Ferris Ln
- 12 Hanscom Ave
- 17 Hammersley Ave
- 324-326 Church St
- 21 Rosalind Rd
- 10 Corlies Ave
- 13 Parkwood Blvd
- 24 Jewett Ave
Your Personal Tour Guide
Ask me questions while you tour the home.