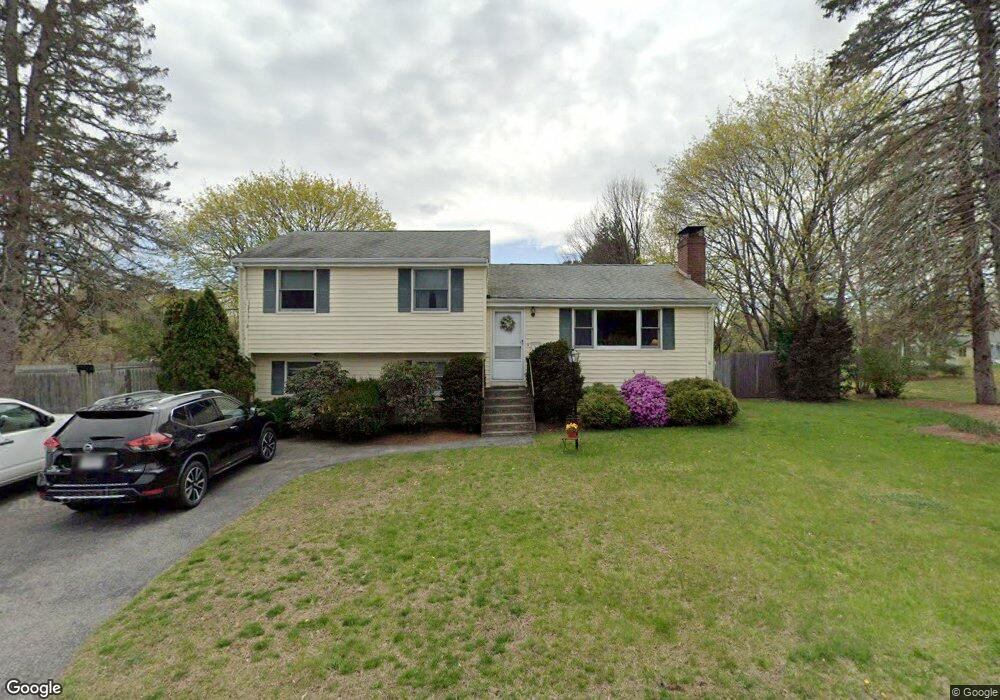
4 Irene Rd Framingham, MA 01701
Nobscot NeighborhoodEstimated Value: $576,000 - $620,000
3
Beds
2
Baths
1,102
Sq Ft
$543/Sq Ft
Est. Value
About This Home
This home is located at 4 Irene Rd, Framingham, MA 01701 and is currently estimated at $598,113, approximately $542 per square foot. 4 Irene Rd is a home located in Middlesex County with nearby schools including Framingham High School, MetroWest Jewish Day School, and Sudbury Valley School.
Ownership History
Date
Name
Owned For
Owner Type
Purchase Details
Closed on
Mar 10, 2017
Sold by
Astapoveh Richard W and Astapoveh Katherine A
Bought by
R W & K A Astapoveh Lt and Astapoveh
Current Estimated Value
Purchase Details
Closed on
Nov 19, 1976
Bought by
Astapoveh Richard W and Astapoveh Katherin
Create a Home Valuation Report for This Property
The Home Valuation Report is an in-depth analysis detailing your home's value as well as a comparison with similar homes in the area
Home Values in the Area
Average Home Value in this Area
Purchase History
We collect this data history from publicly available records. To have your information removed, we recommend requesting removal directly through your county’s website.
| Date | Buyer | Sale Price | Title Company |
|---|---|---|---|
| R W & K A Astapoveh Lt | -- | -- | |
| R W & K A Astapoveh Lt | -- | -- | |
| Astapoveh Richard W | -- | -- |
Source: Public Records
Mortgage History
We collect this data history from publicly available records. To have your information removed, we recommend requesting removal directly through your county’s website.
| Date | Status | Borrower | Loan Amount |
|---|---|---|---|
| Previous Owner | Astapoveh Richard W | $123,800 | |
| Previous Owner | Astapoveh Richard W | $50,000 | |
| Previous Owner | Astapoveh Richard W | $25,000 |
Source: Public Records
Tax History
| Year | Tax Paid | Tax Assessment Tax Assessment Total Assessment is a certain percentage of the fair market value that is determined by local assessors to be the total taxable value of land and additions on the property. | Land | Improvement |
|---|---|---|---|---|
| 2025 | $6,391 | $535,300 | $271,200 | $264,100 |
| 2024 | $6,171 | $495,300 | $242,300 | $253,000 |
| 2023 | $5,816 | $444,300 | $216,200 | $228,100 |
| 2022 | $5,492 | $399,700 | $196,200 | $203,500 |
| 2021 | $5,360 | $381,500 | $188,600 | $192,900 |
| 2020 | $5,343 | $356,700 | $171,400 | $185,300 |
| 2019 | $5,280 | $343,300 | $171,400 | $171,900 |
| 2018 | $5,222 | $320,000 | $165,000 | $155,000 |
| 2017 | $5,133 | $307,200 | $160,200 | $147,000 |
| 2016 | $5,052 | $290,700 | $160,200 | $130,500 |
| 2015 | $5,207 | $292,200 | $160,700 | $131,500 |
Source: Public Records
Map
Nearby Homes
- 62 Hemenway Rd
- 70 Harrington Rd
- 1239 Edgell Rd
- 915 Edgell Rd Unit 61
- 32 Old Framingham Rd Unit 8
- 32 Old Framingham Rd Unit 41
- 30 Nobscot Rd Unit 2
- 7 Edith Rd
- 18 Griffin Rd
- 29 Patricia Rd
- 83 Nicholas Rd Unit D
- 217 Nobscot Rd
- 51 Higgins Rd
- 350 Central St
- 301 Winch St
- 24 Chestnut St Unit 2
- 19 Chestnut St
- 94 Spruce St
- 15 Fenway Dr
- 477 Edgell Rd
Your Personal Tour Guide
Ask me questions while you tour the home.