4 James St Winchester, MA 01890
West Side NeighborhoodEstimated Value: $974,000 - $1,316,445
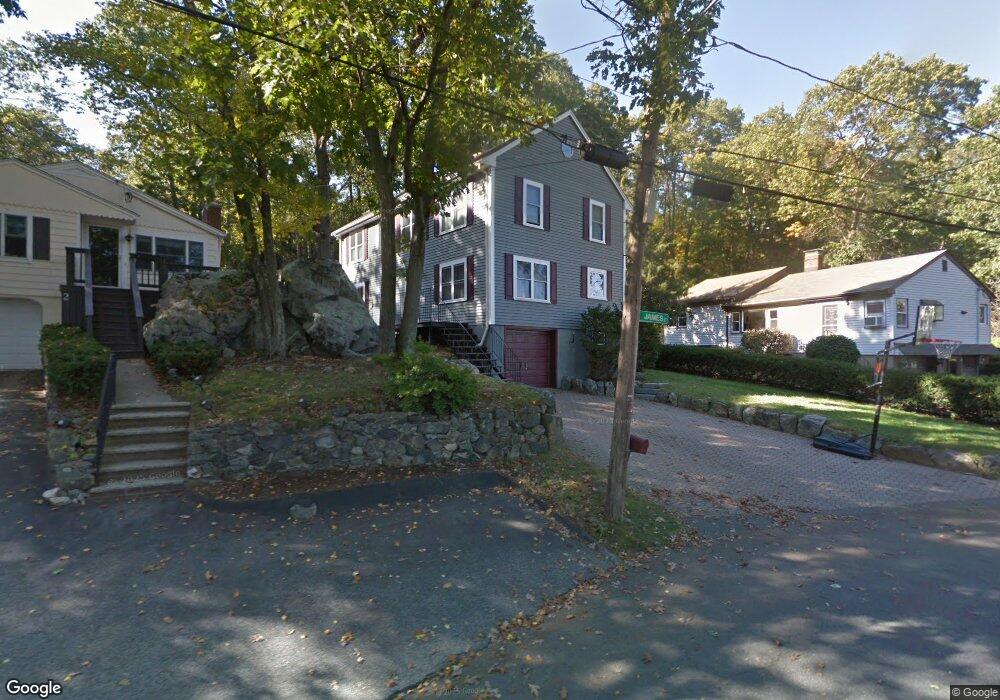
About This Home
This home is located at 4 James St, Winchester, MA 01890 and is currently estimated at $1,169,111, approximately $579 per square foot. 4 James St is a home located in Middlesex County with nearby schools including Vinson-Owen Elementary School, McCall Middle School, and Winchester High School.
Ownership History
We collect this data history from publicly available records. To have your information removed, we recommend requesting removal directly through your county’s website.
Purchase Details
Purchase Details
Home Financials for this Owner
Home Financials are based on the most recent Mortgage that was taken out on this home.Home Values in the Area
Average Home Value in this Area
Purchase History
We collect this data history from publicly available records. To have your information removed, we recommend requesting removal directly through your county’s website.
| Date | Buyer | Sale Price | Title Company |
|---|---|---|---|
| -- | -- | ||
| $179,000 | -- |
Mortgage History
We collect this data history from publicly available records. To have your information removed, we recommend requesting removal directly through your county’s website.
| Date | Status | Borrower | Loan Amount |
|---|---|---|---|
| Previous Owner | $143,200 |
Tax History
We collect this data history from publicly available records. To have your information removed, we recommend requesting removal directly through your county’s website.
| Year | Tax Paid | Tax Assessment Tax Assessment Total Assessment is a certain percentage of the fair market value that is determined by local assessors to be the total taxable value of land and additions on the property. | Land | Improvement |
|---|---|---|---|---|
| 2025 | $119 | $1,070,000 | $624,100 | $445,900 |
| 2024 | $11,767 | $1,038,600 | $624,100 | $414,500 |
| 2023 | $11,566 | $980,200 | $572,100 | $408,100 |
| 2022 | $10,271 | $821,000 | $433,400 | $387,600 |
| 2021 | $5,032 | $812,300 | $424,700 | $387,600 |
| 2020 | $19,778 | $812,300 | $424,700 | $387,600 |
| 2019 | $8,998 | $743,000 | $355,400 | $387,600 |
| 2018 | $4,748 | $715,300 | $338,000 | $377,300 |
| 2017 | $8,320 | $677,500 | $320,700 | $356,800 |
| 2016 | $7,793 | $667,200 | $320,700 | $346,500 |
| 2015 | $7,583 | $624,600 | $290,400 | $334,200 |
| 2014 | $7,282 | $575,200 | $251,400 | $323,800 |
Map
- 63 Dunster Ln
- 298 Forest St
- 281 Forest St
- 7 Ridge St
- 26 Lawrence Ln
- 11 Crescent Hill Ave
- 15 Summer St
- 276 High St
- 37 Mayflower Rd
- 312 Washington St
- 1 Plymouth Rd
- 12 Cox Rd
- 21 Bartlett Ave
- 7 Park Avenue Extension
- 22 Oldham Rd
- 455 Summer St Unit 455
- 105 Thornberry Rd
- 94 Johnson Rd
- 52 Albemarle Ave
- 77 Forest St
Ask me questions while you tour the home.