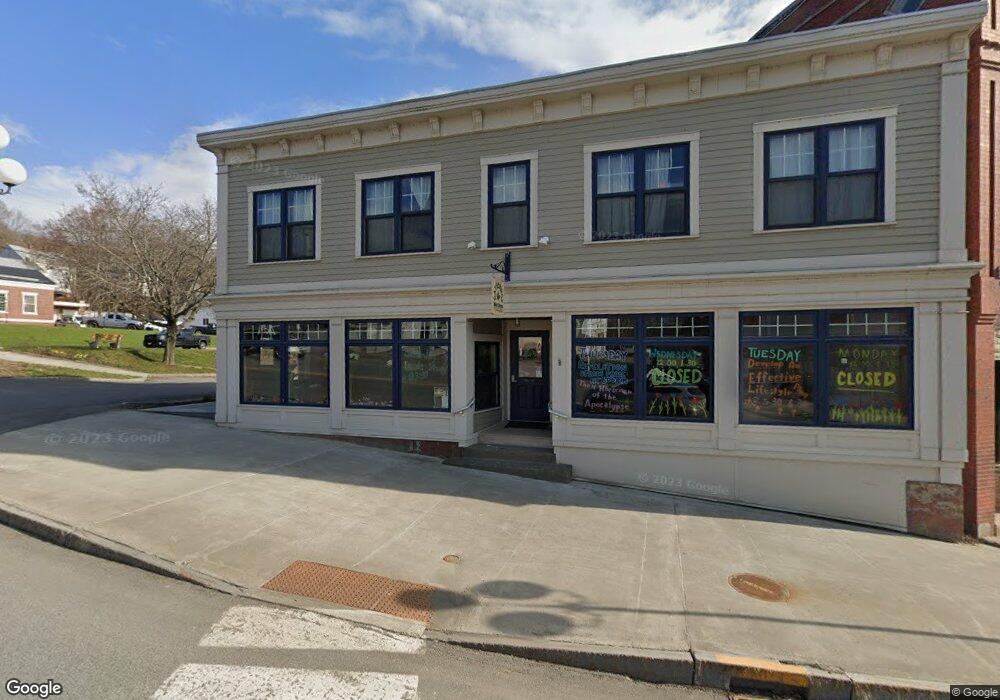
4 Main St Dexter, ME 04930
Estimated Value: $260,000
Studio
--
Bath
2,214
Sq Ft
$117/Sq Ft
Est. Value
About This Home
This home is located at 4 Main St, Dexter, ME 04930 and is currently estimated at $260,000, approximately $117 per square foot. 4 Main St is a home located in Penobscot County with nearby schools including Ridge View Community School, Dexter Regional High School, and Dexter Christian Academy.
Ownership History
Date
Name
Owned For
Owner Type
Purchase Details
Closed on
May 30, 2019
Sold by
Spizuoco Commercial Llc
Bought by
Tritch Todd A and Tritch Dawn H
Current Estimated Value
Purchase Details
Closed on
Jul 29, 2016
Sold by
Dexter Regional Dev Corp
Bought by
Coastal Enterprises Inc
Create a Home Valuation Report for This Property
The Home Valuation Report is an in-depth analysis detailing your home's value as well as a comparison with similar homes in the area
Home Values in the Area
Average Home Value in this Area
Purchase History
| Date | Buyer | Sale Price | Title Company |
|---|---|---|---|
| Tritch Todd A | -- | -- | |
| Tritch Todd A | -- | -- | |
| Coastal Enterprises Inc | -- | -- | |
| Coastal Enterprises Inc | -- | -- |
Source: Public Records
Mortgage History
| Date | Status | Borrower | Loan Amount |
|---|---|---|---|
| Previous Owner | Coastal Enterprises Inc | $1,200,000 |
Source: Public Records
Tax History
| Year | Tax Paid | Tax Assessment Tax Assessment Total Assessment is a certain percentage of the fair market value that is determined by local assessors to be the total taxable value of land and additions on the property. | Land | Improvement |
|---|---|---|---|---|
| 2025 | $3,055 | $153,500 | $9,300 | $144,200 |
| 2024 | $3,009 | $153,500 | $9,300 | $144,200 |
| 2023 | $3,026 | $153,600 | $9,400 | $144,200 |
| 2022 | $3,054 | $152,700 | $8,500 | $144,200 |
| 2021 | $2,993 | $152,700 | $8,500 | $144,200 |
| 2020 | $2,993 | $152,700 | $8,500 | $144,200 |
| 2019 | $2,993 | $152,700 | $8,500 | $144,200 |
| 2018 | $2,993 | $152,700 | $8,500 | $144,200 |
| 2017 | $2,917 | $152,700 | $8,500 | $144,200 |
| 2016 | $3,733 | $200,700 | $8,500 | $192,200 |
| 2015 | $3,248 | $174,600 | $8,500 | $166,100 |
| 2014 | $5,522 | $312,000 | $8,500 | $303,500 |
Source: Public Records
Map
Nearby Homes
Your Personal Tour Guide
Ask me questions while you tour the home.