4 Maple Cir Marblehead, MA 01945
Estimated Value: $640,000 - $817,000
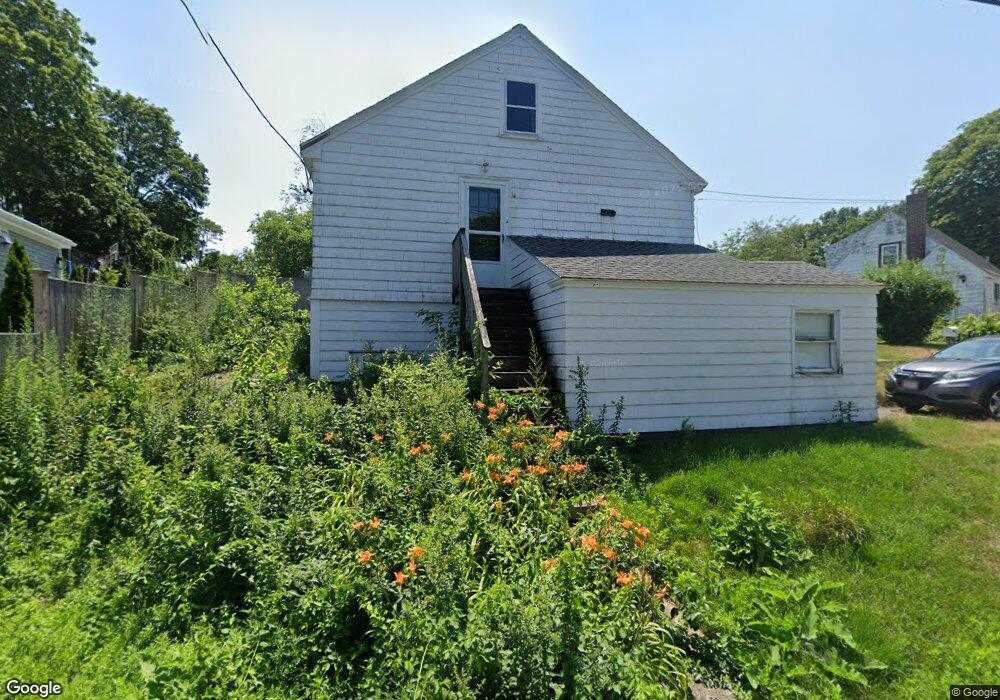
About This Home
This home is located at 4 Maple Cir, Marblehead, MA 01945 and is currently estimated at $729,467, approximately $536 per square foot. 4 Maple Cir is a home located in Essex County with nearby schools including Marblehead High School, Tower School, and Devereux School.
Ownership History
We collect this data history from publicly available records. To have your information removed, we recommend requesting removal directly through your county’s website.
Purchase Details
Home Financials for this Owner
Home Financials are based on the most recent Mortgage that was taken out on this home.Home Values in the Area
Average Home Value in this Area
Purchase History
We collect this data history from publicly available records. To have your information removed, we recommend requesting removal directly through your county’s website.
| Date | Buyer | Sale Price | Title Company |
|---|---|---|---|
| $288,000 | -- |
Mortgage History
We collect this data history from publicly available records. To have your information removed, we recommend requesting removal directly through your county’s website.
| Date | Status | Borrower | Loan Amount |
|---|---|---|---|
| Open | $194,687 | ||
| Closed | $230,000 | ||
| Closed | $230,000 |
Tax History
We collect this data history from publicly available records. To have your information removed, we recommend requesting removal directly through your county’s website.
| Year | Tax Paid | Tax Assessment Tax Assessment Total Assessment is a certain percentage of the fair market value that is determined by local assessors to be the total taxable value of land and additions on the property. | Land | Improvement |
|---|---|---|---|---|
| 2025 | $6,174 | $682,200 | $533,800 | $148,400 |
| 2024 | $5,617 | $626,900 | $533,800 | $93,100 |
| 2023 | $5,917 | $591,700 | $486,300 | $105,400 |
| 2022 | $5,716 | $543,300 | $438,900 | $104,400 |
| 2021 | $5,290 | $507,700 | $403,300 | $104,400 |
| 2020 | $5,116 | $492,400 | $403,300 | $89,100 |
| 2019 | $4,895 | $455,800 | $367,700 | $88,100 |
| 2018 | $4,762 | $432,100 | $344,000 | $88,100 |
| 2017 | $4,496 | $408,400 | $320,300 | $88,100 |
| 2016 | $4,269 | $384,600 | $296,500 | $88,100 |
| 2015 | $3,932 | $354,900 | $272,800 | $82,100 |
| 2014 | $3,651 | $329,200 | $249,100 | $80,100 |
Map
- 26 Cedar St Unit 2
- 6 Shetland Rd
- 10 Charlotte Rd
- 8 Charlotte Rd
- 9 Cedar St
- 30 Shetland Rd
- 67 Humphrey St Unit 1
- 67 Humphrey St
- 18 Rose Ave
- 11 Angenica Terrace
- 20 Elmwood Rd
- 3 Countryside Ln
- 212 Humphrey St Unit 202
- 19 Humphrey St
- 25 Countryside Ln
- 32 Pilgrim Rd
- 2 Rolleston Rd
- 411 Atlantic Ave Unit 2
- 16 Preston Beach Rd
- 82 Cornell Rd
Ask me questions while you tour the home.