4 Marsh Ave Beverly, MA 01915
Ryal Side NeighborhoodEstimated Value: $818,000 - $865,517
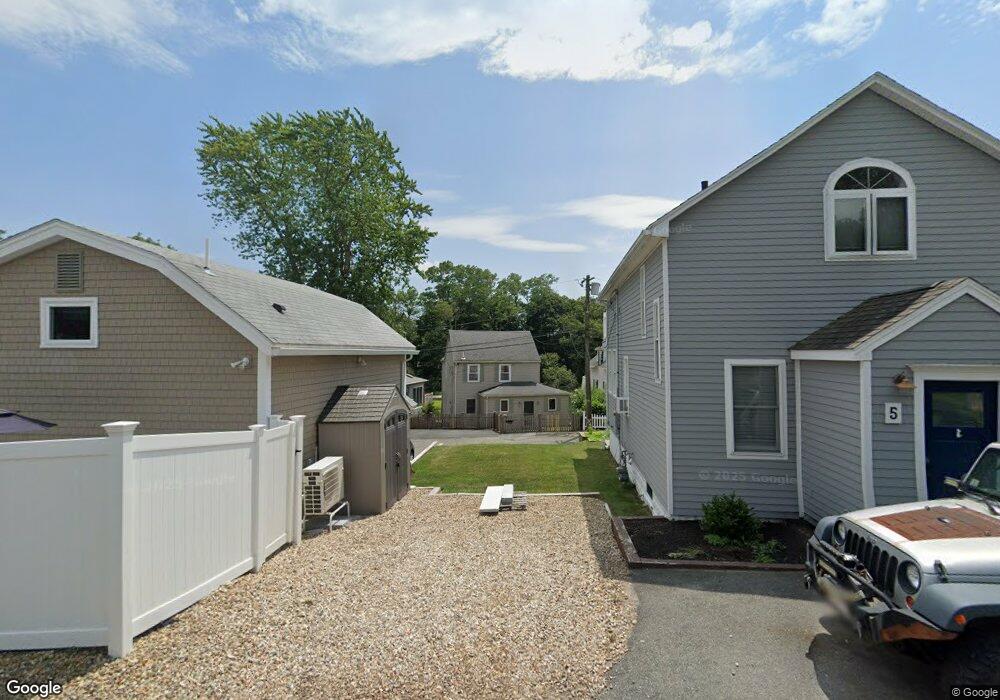
About This Home
This home is located at 4 Marsh Ave, Beverly, MA 01915 and is currently estimated at $841,629, approximately $643 per square foot. 4 Marsh Ave is a home located in Essex County with nearby schools including Beverly High School, Mrs Alexander's School, and The Saints Academy.
Ownership History
We collect this data history from publicly available records. To have your information removed, we recommend requesting removal directly through your county’s website.
Purchase Details
Purchase Details
Home Values in the Area
Average Home Value in this Area
Purchase History
We collect this data history from publicly available records. To have your information removed, we recommend requesting removal directly through your county’s website.
| Date | Buyer | Sale Price | Title Company |
|---|---|---|---|
| -- | -- | ||
| $168,900 | -- |
Mortgage History
We collect this data history from publicly available records. To have your information removed, we recommend requesting removal directly through your county’s website.
| Date | Status | Borrower | Loan Amount |
|---|---|---|---|
| Open | $100,000 | ||
| Previous Owner | $100,000 | ||
| Previous Owner | $99,700 | ||
| Previous Owner | $30,000 | ||
| Previous Owner | $117,780 | ||
| Previous Owner | $74,000 |
Tax History
We collect this data history from publicly available records. To have your information removed, we recommend requesting removal directly through your county’s website.
| Year | Tax Paid | Tax Assessment Tax Assessment Total Assessment is a certain percentage of the fair market value that is determined by local assessors to be the total taxable value of land and additions on the property. | Land | Improvement |
|---|---|---|---|---|
| 2025 | $9,914 | $902,100 | $716,100 | $186,000 |
| 2024 | $9,311 | $829,100 | $643,100 | $186,000 |
| 2023 | $8,841 | $785,200 | $599,200 | $186,000 |
| 2022 | $8,267 | $679,300 | $493,300 | $186,000 |
| 2021 | $7,650 | $602,400 | $434,800 | $167,600 |
| 2020 | $7,307 | $569,500 | $401,900 | $167,600 |
| 2019 | $6,489 | $491,200 | $328,800 | $162,400 |
| 2018 | $5,668 | $416,800 | $268,600 | $148,200 |
| 2017 | $5,108 | $357,700 | $209,500 | $148,200 |
| 2016 | $4,916 | $341,600 | $193,400 | $148,200 |
| 2015 | $4,820 | $341,600 | $193,400 | $148,200 |
Map
- 9 Parkview Ave
- 37 Hillcrest Ave
- 7 E Garfield Ave
- 122 Livingstone Ave
- 13 Hillcrest Ave
- 108 Bridge St Unit 1
- 11 Kernwood Ave
- 114 Livingstone Ave
- 3 Cove Ave
- 25 Eastern Ave
- 34 Kernwood Ave
- 27 Hayes Ave
- 38 Folger Ave
- 35 Doty Ave
- 17 Kernwood Heights
- 21 Bridge St
- 19 Greene St
- 21 Goldsmith Ave
- 11 Friend St
- 37 Wellman St Unit 3
Ask me questions while you tour the home.