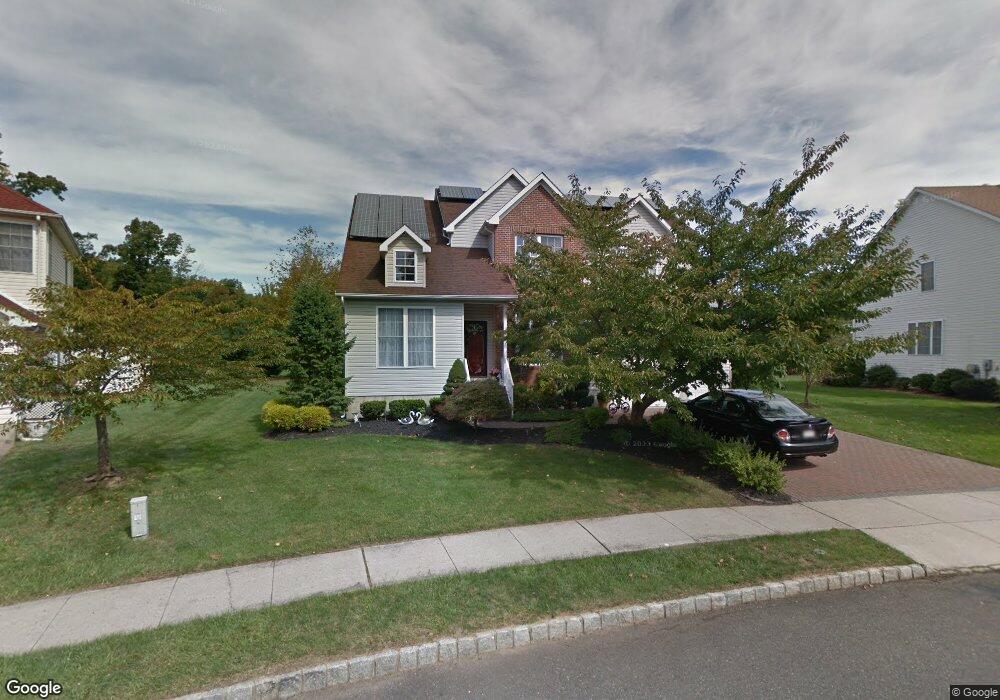
4 Putnam Rd Monmouth Junction, NJ 08852
Estimated Value: $853,788 - $980,000
Studio
--
Bath
2,310
Sq Ft
$402/Sq Ft
Est. Value
About This Home
This home is located at 4 Putnam Rd, Monmouth Junction, NJ 08852 and is currently estimated at $929,197, approximately $402 per square foot. 4 Putnam Rd is a home located in Middlesex County with nearby schools including Brooks Crossing Elementary School, Crossroads North Middle School, and South Brunswick High School.
Ownership History
Date
Name
Owned For
Owner Type
Purchase Details
Closed on
Aug 26, 1998
Sold by
Crossing Deans Pond
Bought by
Jain Sunil and Jain Kiran
Current Estimated Value
Home Financials for this Owner
Home Financials are based on the most recent Mortgage that was taken out on this home.
Original Mortgage
$189,500
Interest Rate
6.8%
Create a Home Valuation Report for This Property
The Home Valuation Report is an in-depth analysis detailing your home's value as well as a comparison with similar homes in the area
Home Values in the Area
Average Home Value in this Area
Purchase History
We collect this data history from publicly available records. To have your information removed, we recommend requesting removal directly through your county’s website.
| Date | Buyer | Sale Price | Title Company |
|---|---|---|---|
| Jain Sunil | $240,096 | -- |
Source: Public Records
Mortgage History
We collect this data history from publicly available records. To have your information removed, we recommend requesting removal directly through your county’s website.
| Date | Status | Borrower | Loan Amount |
|---|---|---|---|
| Previous Owner | Jain Sunil | $189,500 |
Source: Public Records
Tax History
| Year | Tax Paid | Tax Assessment Tax Assessment Total Assessment is a certain percentage of the fair market value that is determined by local assessors to be the total taxable value of land and additions on the property. | Land | Improvement |
|---|---|---|---|---|
| 2025 | $13,597 | $251,700 | $60,000 | $191,700 |
| 2024 | $13,109 | $251,700 | $60,000 | $191,700 |
| 2023 | $13,109 | $251,700 | $60,000 | $191,700 |
| 2022 | $12,718 | $251,700 | $60,000 | $191,700 |
| 2021 | $7,655 | $251,700 | $60,000 | $191,700 |
| 2020 | $12,796 | $251,700 | $60,000 | $191,700 |
| 2019 | $12,912 | $251,700 | $60,000 | $191,700 |
| 2018 | $12,489 | $251,700 | $60,000 | $191,700 |
| 2017 | $12,472 | $251,700 | $60,000 | $191,700 |
| 2016 | $12,341 | $251,700 | $60,000 | $191,700 |
| 2015 | $11,963 | $251,700 | $60,000 | $191,700 |
| 2014 | $11,769 | $251,700 | $60,000 | $191,700 |
Source: Public Records
Map
Nearby Homes
Your Personal Tour Guide
Ask me questions while you tour the home.