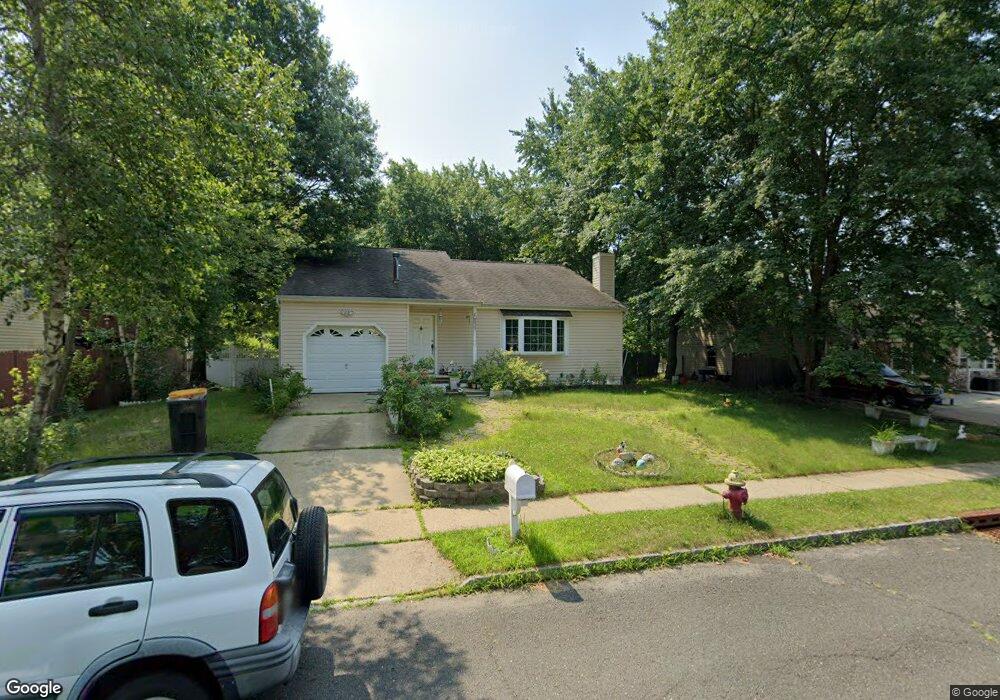
4 Rachele Ct Matawan, NJ 07747
Estimated Value: $490,018 - $649,000
Studio
--
Bath
1,392
Sq Ft
$414/Sq Ft
Est. Value
About This Home
This home is located at 4 Rachele Ct, Matawan, NJ 07747 and is currently estimated at $575,755, approximately $413 per square foot. 4 Rachele Ct is a home located in Middlesex County with nearby schools including Old Bridge High School, Minding Miracles Learning Center, and Matawan Montessori Academy.
Ownership History
Date
Name
Owned For
Owner Type
Purchase Details
Closed on
Sep 27, 2012
Sold by
Rentas Iris
Bought by
Rentas Iris and Roman Iris M
Current Estimated Value
Purchase Details
Closed on
Dec 29, 1994
Sold by
Evergreen Cenpipco Inc
Bought by
Top Quality Inc
Home Financials for this Owner
Home Financials are based on the most recent Mortgage that was taken out on this home.
Original Mortgage
$290,000
Interest Rate
9.13%
Purchase Details
Closed on
Jun 9, 1994
Sold by
Naples Dominick
Bought by
Rentas Iris
Home Financials for this Owner
Home Financials are based on the most recent Mortgage that was taken out on this home.
Original Mortgage
$132,000
Interest Rate
8.5%
Create a Home Valuation Report for This Property
The Home Valuation Report is an in-depth analysis detailing your home's value as well as a comparison with similar homes in the area
Home Values in the Area
Average Home Value in this Area
Purchase History
| Date | Buyer | Sale Price | Title Company |
|---|---|---|---|
| Rentas Iris | -- | None Available | |
| Rentas Iris | -- | None Available | |
| Top Quality Inc | $350,000 | -- | |
| Rentas Iris | $165,000 | -- |
Source: Public Records
Mortgage History
| Date | Status | Borrower | Loan Amount |
|---|---|---|---|
| Closed | Top Quality Inc | $290,000 | |
| Previous Owner | Rentas Iris | $132,000 |
Source: Public Records
Tax History
| Year | Tax Paid | Tax Assessment Tax Assessment Total Assessment is a certain percentage of the fair market value that is determined by local assessors to be the total taxable value of land and additions on the property. | Land | Improvement |
|---|---|---|---|---|
| 2025 | $9,208 | $160,200 | $60,700 | $99,500 |
| 2024 | $8,846 | $160,200 | $60,700 | $99,500 |
| 2023 | $8,846 | $160,200 | $60,700 | $99,500 |
| 2022 | $8,572 | $160,200 | $60,700 | $99,500 |
| 2021 | $5,454 | $160,200 | $60,700 | $99,500 |
| 2020 | $8,079 | $160,200 | $60,700 | $99,500 |
| 2019 | $8,201 | $160,200 | $60,700 | $99,500 |
| 2018 | $7,851 | $160,200 | $60,700 | $99,500 |
| 2017 | $7,853 | $160,200 | $60,700 | $99,500 |
| 2016 | $7,693 | $160,200 | $60,700 | $99,500 |
| 2015 | $7,563 | $160,200 | $60,700 | $99,500 |
| 2014 | $7,485 | $160,200 | $60,700 | $99,500 |
Source: Public Records
Map
Nearby Homes
- 18 Rachele Ct
- 159 Washington Ave
- 138 Washington Ave
- 12 Euclid Rd
- 15 Michelle Ave
- 95 Athens Ave
- 10 Russell Ct
- 109 Fawn Dr
- 16 Pendleton Place
- 34 Staghorn Dr
- 78 Washington Ave
- 56 Washington Ave
- 48 Ellen Heath Dr
- 2 Grenoble Ct
- 247 Cottrell Rd
- 11 Sheffield Ct
- 4 Old Bridge Plaza
- 96 Brewster Cir
- 18 Warne Rd
- 292 Cottrell Rd
Your Personal Tour Guide
Ask me questions while you tour the home.