4 Short St Medway, MA 02053
Estimated Value: $802,000 - $949,000
About This Home
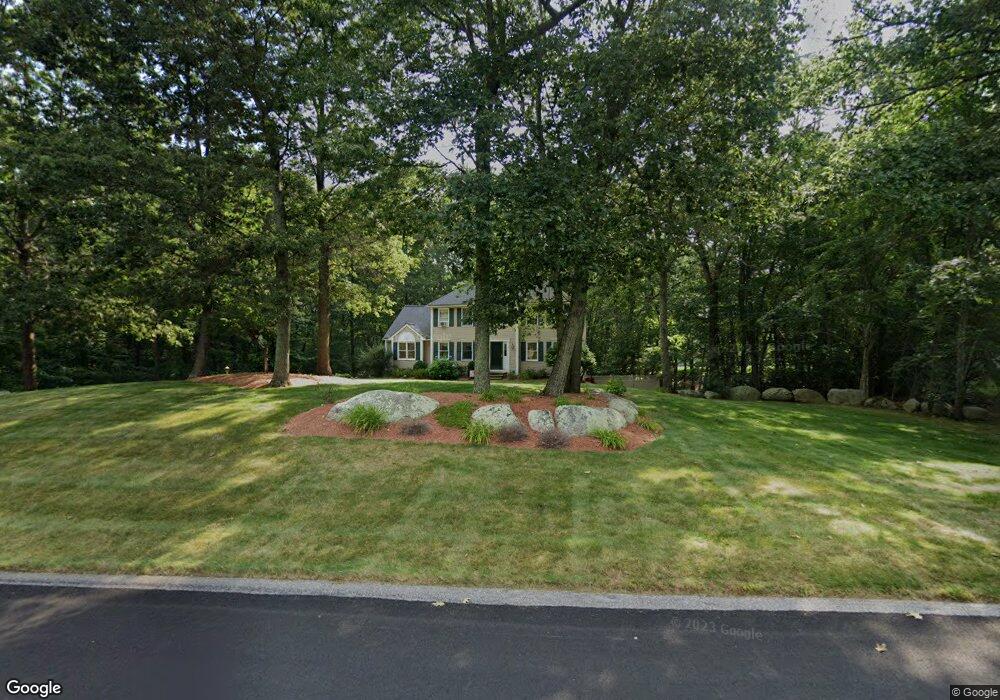
This home is located at 4 Short St, Medway, MA 02053 and is currently estimated at $871,477, approximately $384 per square foot. 4 Short St is a home located in Norfolk County with nearby schools including John D. McGovern Elementary School, Burke-Memorial Elementary, and Medway Middle School.
Ownership History
We collect this data history from publicly available records. To have your information removed, we recommend requesting removal directly through your county’s website.
Purchase Details
Purchase Details
Home Financials for this Owner
Home Financials are based on the most recent Mortgage that was taken out on this home.Home Values in the Area
Average Home Value in this Area
Purchase History
We collect this data history from publicly available records. To have your information removed, we recommend requesting removal directly through your county’s website.
| Date | Buyer | Sale Price | Title Company |
|---|---|---|---|
| -- | -- | ||
| $251,400 | -- |
Mortgage History
We collect this data history from publicly available records. To have your information removed, we recommend requesting removal directly through your county’s website.
| Date | Status | Borrower | Loan Amount |
|---|---|---|---|
| Previous Owner | $208,000 | ||
| Previous Owner | $219,000 | ||
| Previous Owner | $208,000 | ||
| Previous Owner | $220,000 |
Tax History
We collect this data history from publicly available records. To have your information removed, we recommend requesting removal directly through your county’s website.
| Year | Tax Paid | Tax Assessment Tax Assessment Total Assessment is a certain percentage of the fair market value that is determined by local assessors to be the total taxable value of land and additions on the property. | Land | Improvement |
|---|---|---|---|---|
| 2025 | $9,770 | $685,600 | $340,000 | $345,600 |
| 2024 | $9,873 | $685,600 | $340,000 | $345,600 |
| 2023 | $9,760 | $612,300 | $309,500 | $302,800 |
| 2022 | $8,685 | $513,000 | $228,900 | $284,100 |
| 2021 | $8,559 | $490,200 | $213,600 | $276,600 |
| 2020 | $8,383 | $479,000 | $213,600 | $265,400 |
| 2019 | $7,905 | $465,800 | $204,900 | $260,900 |
| 2018 | $7,954 | $450,400 | $196,200 | $254,200 |
| 2017 | $7,913 | $441,600 | $191,900 | $249,700 |
| 2016 | $7,813 | $431,400 | $176,600 | $254,800 |
| 2015 | $7,745 | $424,600 | $174,400 | $250,200 |
| 2014 | $7,907 | $419,700 | $174,600 | $245,100 |
Map
- 12 Alder St
- 28 Fisher St
- 15 Carp Rd
- 1 Castle Rd
- 23 Williamsburg Way Unit 23
- 423 South St
- 67 Zain Cir
- 44 Granite St
- 12 Zain Cir Unit 12
- 1 Fisher St
- 21 Autumn Rd
- 50 Milford St
- 21 Stable Way
- 39 Stallbrook Rd
- 121 Twin Brook Ln
- 35 Milford St
- 11 Aris Way
- 16 Stable Way
- 40 Black Bear Cir Unit 40
- 455 Hartford Ave
Ask me questions while you tour the home.