Estimated Value: $2,165,000 - $2,478,000
About This Home
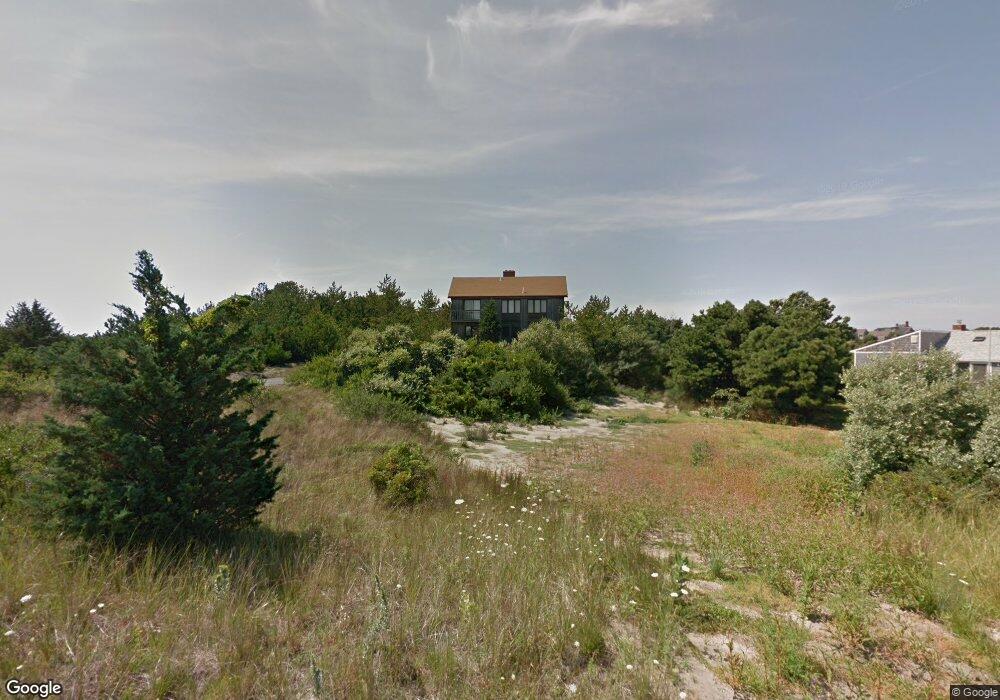
This home is located at 4 Sky View Dr, Truro, MA 02666 and is currently estimated at $2,292,083, approximately $771 per square foot. 4 Sky View Dr is a home with nearby schools including Truro Central School.
Ownership History
We collect this data history from publicly available records. To have your information removed, we recommend requesting removal directly through your county’s website.
Purchase Details
Home Financials for this Owner
Home Financials are based on the most recent Mortgage that was taken out on this home.Purchase Details
Purchase Details
Home Financials for this Owner
Home Financials are based on the most recent Mortgage that was taken out on this home.Home Values in the Area
Average Home Value in this Area
Purchase History
We collect this data history from publicly available records. To have your information removed, we recommend requesting removal directly through your county’s website.
| Date | Buyer | Sale Price | Title Company |
|---|---|---|---|
| $1,355,000 | -- | ||
| -- | -- | ||
| $650,000 | -- |
Mortgage History
We collect this data history from publicly available records. To have your information removed, we recommend requesting removal directly through your county’s website.
| Date | Status | Borrower | Loan Amount |
|---|---|---|---|
| Open | $650,000 | ||
| Previous Owner | $520,000 |
Tax History
We collect this data history from publicly available records. To have your information removed, we recommend requesting removal directly through your county’s website.
| Year | Tax Paid | Tax Assessment Tax Assessment Total Assessment is a certain percentage of the fair market value that is determined by local assessors to be the total taxable value of land and additions on the property. | Land | Improvement |
|---|---|---|---|---|
| 2025 | $12,610 | $2,040,400 | $712,000 | $1,328,400 |
| 2024 | $11,543 | $1,927,100 | $704,900 | $1,222,200 |
| 2023 | $10,870 | $1,662,100 | $612,900 | $1,049,200 |
| 2022 | $10,047 | $1,299,800 | $528,300 | $771,500 |
| 2021 | $9,201 | $1,246,800 | $528,300 | $718,500 |
| 2020 | $8,432 | $1,150,300 | $523,100 | $627,200 |
| 2019 | $6,552 | $879,400 | $439,400 | $440,000 |
| 2018 | $5,072 | $688,200 | $439,400 | $248,800 |
| 2017 | $4,705 | $674,100 | $439,400 | $234,700 |
| 2016 | $4,505 | $665,400 | $435,100 | $230,300 |
| 2015 | $4,346 | $655,500 | $430,800 | $224,700 |
Map
- 5 High Ridge Road Extension
- 7 Great Hollow Rd Unit 50
- 27 Fishermans Rd
- 47 Fishermans Rd
- 23 Crestview Cir
- 25 Resolution Rd
- 7 Great Hollow Rd Unit 50
- 1 Captain Williams Way
- 52 Corn Hill Rd
- 25 Noons Dr
- 11 Whitmanville Rd
- 7 Fishermans Rd
- 12 Parker Dr
- 12 Parker Dr
- 5 Fishermans Rd
- 332 U S 6
- 2 Short Lots Ln
- 9 Kinnikinnick Rd
- 7 Turnstone Rd
- 14 N Union Field Rd
- 4 Skyview
- 4 Sky View Dr
- 2 Old Colony Way
- 6 Sky View Dr
- 6 Sky View Dr
- 36 Great Hollow Ln
- 36 Great Hollow Rd
- 2 Old Colony Way
- 34 Great Hollow Rd
- 5 Sky View Dr
- 1 Sky View Dr
- 5 Obbo Dr
- 6 Quail Way
- 3 Obbo Dr
- 8 Sunset Ln
- 8 Sky View Dr
- 2 High Ridge Road Extension
- 33 Great Hollow Ln
- 3 High Ridge Rd
- 3 High Ridge Rd
Ask me questions while you tour the home.