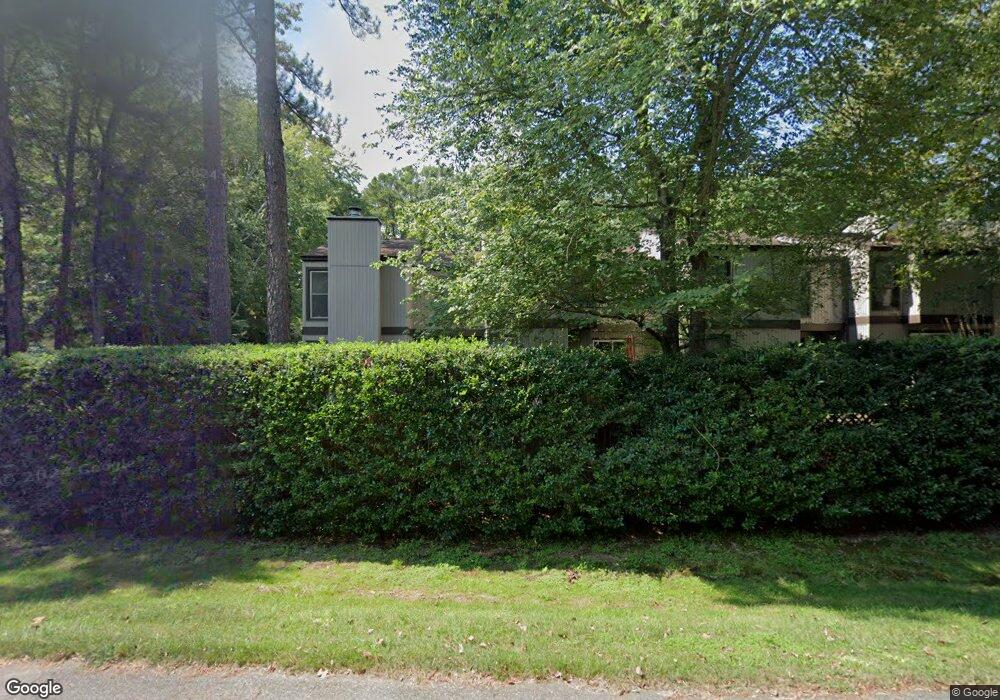
4 Spring W Williamsburg, VA 23188
Centerville NeighborhoodEstimated Value: $256,000 - $274,000
3
Beds
3
Baths
1,552
Sq Ft
$172/Sq Ft
Est. Value
About This Home
This home is located at 4 Spring W, Williamsburg, VA 23188 and is currently estimated at $267,302, approximately $172 per square foot. 4 Spring W is a home located in James City County with nearby schools including D.J. Montague Elementary School, Lois Hornsby Middle School, and Lafayette High School.
Ownership History
Date
Name
Owned For
Owner Type
Purchase Details
Closed on
Jul 7, 2022
Sold by
Stephens Jr John C and Stephens Bonnie W
Bought by
Rogerson George T
Current Estimated Value
Purchase Details
Closed on
Sep 26, 2008
Sold by
Mulford Stanley H
Bought by
Stephens John C
Purchase Details
Closed on
Jun 17, 2004
Sold by
Rogerson Walter G
Bought by
Stephesn John C
Home Financials for this Owner
Home Financials are based on the most recent Mortgage that was taken out on this home.
Original Mortgage
$55,000
Interest Rate
6.12%
Mortgage Type
New Conventional
Create a Home Valuation Report for This Property
The Home Valuation Report is an in-depth analysis detailing your home's value as well as a comparison with similar homes in the area
Home Values in the Area
Average Home Value in this Area
Purchase History
| Date | Buyer | Sale Price | Title Company |
|---|---|---|---|
| Rogerson George T | -- | None Listed On Document | |
| Stephens John C | $175,000 | -- | |
| Stephesn John C | $105,000 | -- |
Source: Public Records
Mortgage History
| Date | Status | Borrower | Loan Amount |
|---|---|---|---|
| Previous Owner | Stephesn John C | $55,000 |
Source: Public Records
Tax History
| Year | Tax Paid | Tax Assessment Tax Assessment Total Assessment is a certain percentage of the fair market value that is determined by local assessors to be the total taxable value of land and additions on the property. | Land | Improvement |
|---|---|---|---|---|
| 2025 | $1,615 | $223,900 | $42,000 | $181,900 |
| 2023 | $1,615 | $194,600 | $40,000 | $154,600 |
| 2022 | $1,615 | $194,600 | $40,000 | $154,600 |
| 2021 | $1,447 | $172,300 | $40,000 | $132,300 |
| 2020 | $1,447 | $172,300 | $40,000 | $132,300 |
| 2019 | $1,368 | $162,900 | $38,000 | $124,900 |
| 2018 | $1,368 | $162,900 | $38,000 | $124,900 |
| 2017 | $1,368 | $162,900 | $38,000 | $124,900 |
| 2016 | $1,368 | $162,900 | $38,000 | $124,900 |
| 2015 | -- | $151,000 | $38,000 | $113,000 |
| 2014 | $32,303 | $151,000 | $38,000 | $113,000 |
Source: Public Records
Map
Nearby Homes
- 2 Spring W Unit W
- 2 Spring W
- 11 Spring W
- 12 Autumn E
- 4 Autumn E
- 2 Clarendon Ct
- 533 Spring Trace
- 5302 Sloane Square
- 942 Pheasant Run
- 105 Heron Ct
- 304 Hempstead Rd
- 126 Seton Hill Rd
- 137 Seton Hill Rd
- 206 Buford Rd
- 178 Devon Rd
- 5361 Ridgewood Hills Dr
- 5333 Ridgewood Hills Dr
- 5341 Ridgewood Hills Dr
- 5353 Ridgewood Hills Dr
- 5329 Ridgewood Hills Dr
Your Personal Tour Guide
Ask me questions while you tour the home.