4 Sumner Rd Salem, MA 01970
South Salem NeighborhoodEstimated Value: $579,000 - $703,292
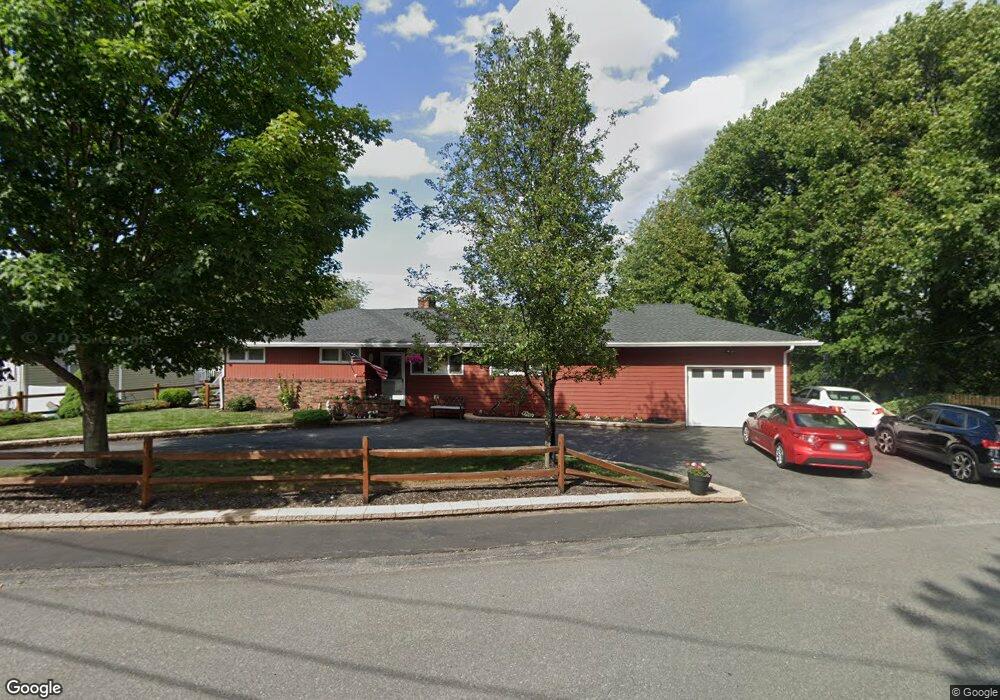
About This Home
This home is located at 4 Sumner Rd, Salem, MA 01970 and is currently estimated at $669,073, approximately $469 per square foot. 4 Sumner Rd is a home located in Essex County with nearby schools including Saltonstall School, Horace Mann Laboratory, and Witchcraft Heights Elementary School.
Ownership History
We collect this data history from publicly available records. To have your information removed, we recommend requesting removal directly through your county’s website.
Purchase Details
Home Financials for this Owner
Home Financials are based on the most recent Mortgage that was taken out on this home.Purchase Details
Purchase Details
Home Values in the Area
Average Home Value in this Area
Purchase History
We collect this data history from publicly available records. To have your information removed, we recommend requesting removal directly through your county’s website.
| Date | Buyer | Sale Price | Title Company |
|---|---|---|---|
| $450,000 | -- | ||
| $450,000 | -- | ||
| -- | -- | ||
| -- | -- |
Mortgage History
We collect this data history from publicly available records. To have your information removed, we recommend requesting removal directly through your county’s website.
| Date | Status | Borrower | Loan Amount |
|---|---|---|---|
| Open | $250,000 | ||
| Closed | $250,000 |
Tax History
We collect this data history from publicly available records. To have your information removed, we recommend requesting removal directly through your county’s website.
| Year | Tax Paid | Tax Assessment Tax Assessment Total Assessment is a certain percentage of the fair market value that is determined by local assessors to be the total taxable value of land and additions on the property. | Land | Improvement |
|---|---|---|---|---|
| 2025 | $7,123 | $628,100 | $206,800 | $421,300 |
| 2024 | $7,153 | $615,600 | $195,200 | $420,400 |
| 2023 | $6,875 | $549,600 | $177,700 | $371,900 |
| 2022 | $6,145 | $463,800 | $163,100 | $300,700 |
| 2021 | $5,934 | $430,000 | $151,500 | $278,500 |
| 2020 | $5,747 | $397,700 | $148,600 | $249,100 |
| 2019 | $5,599 | $370,800 | $139,800 | $231,000 |
| 2018 | $5,418 | $352,300 | $130,500 | $221,800 |
| 2017 | $5,373 | $338,800 | $122,400 | $216,400 |
| 2016 | $5,309 | $338,800 | $122,400 | $216,400 |
| 2015 | $4,823 | $293,900 | $107,800 | $186,100 |
Map
- 3 Preston Rd Unit 1
- 11 Adams St
- 23 Marion Rd Unit B
- 88 Moffatt Rd
- 16 Loring Ave Unit 2
- 16 Loring Ave Unit 3
- 18 Loring Ave Unit 2
- 18 Loring Ave Unit 1
- 18 Loring Ave Unit 3
- 2 Arnold Dr Unit D15
- 11 Read St Unit 3
- 80 Linden St Unit 80
- 16 Cloutman St Unit 2
- 15 Oak View Ave
- 18 Cliff St
- 16 Laurent Rd
- 7 Cedarcrest Rd
- 184 Ocean Ave W Unit 1
- 1 Elm Ave
- 11 Angenica Terrace
Ask me questions while you tour the home.