4 Tarragon Dr Johnston, RI 02919
Bishop Heights NeighborhoodEstimated Value: $573,000 - $634,000
About This Home
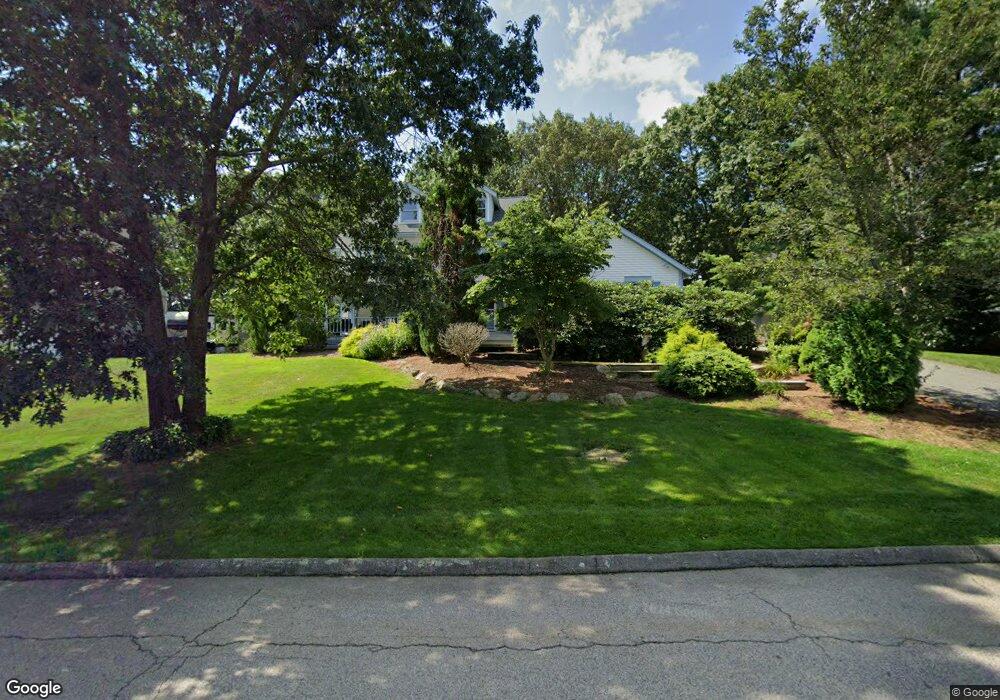
This home is located at 4 Tarragon Dr, Johnston, RI 02919 and is currently estimated at $615,833, approximately $225 per square foot. 4 Tarragon Dr is a home located in Providence County with nearby schools including Johnston Senior High School and St Rocco School.
Ownership History
We collect this data history from publicly available records. To have your information removed, we recommend requesting removal directly through your county’s website.
Purchase Details
Purchase Details
Home Financials for this Owner
Home Financials are based on the most recent Mortgage that was taken out on this home.Home Values in the Area
Average Home Value in this Area
Purchase History
We collect this data history from publicly available records. To have your information removed, we recommend requesting removal directly through your county’s website.
| Date | Buyer | Sale Price | Title Company |
|---|---|---|---|
| -- | -- | ||
| $400,000 | None Available | ||
| -- | None Available |
Mortgage History
We collect this data history from publicly available records. To have your information removed, we recommend requesting removal directly through your county’s website.
| Date | Status | Borrower | Loan Amount |
|---|---|---|---|
| Previous Owner | $314,500 | ||
| Previous Owner | $40,000 | ||
| Previous Owner | $25,000 | ||
| Closed | $166,800 |
Tax History
We collect this data history from publicly available records. To have your information removed, we recommend requesting removal directly through your county’s website.
| Year | Tax Paid | Tax Assessment Tax Assessment Total Assessment is a certain percentage of the fair market value that is determined by local assessors to be the total taxable value of land and additions on the property. | Land | Improvement |
|---|---|---|---|---|
| 2025 | $8,480 | $542,900 | $99,700 | $443,200 |
| 2024 | $8,306 | $542,900 | $99,700 | $443,200 |
| 2023 | $8,306 | $542,900 | $99,700 | $443,200 |
| 2022 | $6,725 | $361,700 | $80,700 | $281,000 |
| 2021 | $8,406 | $361,700 | $80,700 | $281,000 |
| 2018 | $9,220 | $335,400 | $74,400 | $261,000 |
| 2016 | $12,198 | $335,400 | $74,400 | $261,000 |
| 2015 | $8,711 | $300,500 | $72,100 | $228,400 |
| 2014 | $6,912 | $300,500 | $72,100 | $228,400 |
| 2013 | $8,639 | $300,500 | $72,100 | $228,400 |
Map
- 81 S Golden View Dr
- 115 Hilltop Dr
- 0 Autumn Dr
- 21 Primrose Ln
- 0 Central Ave Lot 2
- 1264 Central Ave
- 7 Boulder Dr
- 14 Reservoir Ave
- 22 Golden View Dr
- 2 Reservoir Ave
- 1291 Central Ave
- 9 Justin Ct
- 13 Justin Ct
- 2484 Hartford Ave
- 4 Belfield Dr Unit 1337603
- 3 Belfield Dr Unit 1337601
- 4 Upper Farm Way
- 1 Upper Farm Way
- 3 Upper Farm Way
- 25 Belfield Dr
- 6 Tarragon Dr
- 1078 Central Ave
- 1076 Central Ave
- 42 Beechnut Dr
- 7 Tarragon Dr
- 5 Tarragon Dr
- 10 Tarragon Dr
- 40 Beechnut Dr
- 1074 Central Ave
- 3 Tarragon Dr
- 9 Tarragon Dr
- 1072 Central Ave
- 1 Tarragon Dr
- 12 Tarragon Dr
- 20 Cinnamon Dr
- 20 Caraway Dr
- 45 Beechnut Dr
- 41 Beechnut Dr
- 43 Beechnut Dr
- 11 Tarragon Dr
Ask me questions while you tour the home.